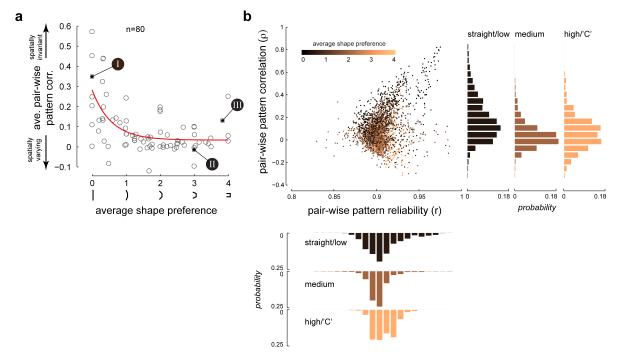
Fig 5. Neurons with preference for curvature have limited spatial invariance.
(a) Average correlation between pairs of response patterns (averaged across all possible pairs of spatially significant response locations for each neuron, see Methods) plotted against the average shape preference for all neurons in our population (n=80) shows an inverse power law relationship (R2 = 0.4). Average pattern correlation is high for neurons tuned for straight/low curvature, while the pattern correlation is low for neurons tuned for high curvature/“C”, indicating a tradeoff between curvature and spatial invariance. The three example neurons in Figs 2 and 3 are indicated. (b) Scatter plot of pair-wise pattern correlation versus pair-wise pattern reliability for all possible pairs of significant response locations in our entire neuronal population. The colors indicate the average shape preference of the neuron to which the location pair belongs. Right histograms: Distribution of pattern correlation for pairs that came from three sub-population of neurons: neurons with average shape preference for straight/low curvature (shape preference values between 0 and 1), those that came from neurons with average shape preference for medium curvature (shape preference values between 1.5 and 2.5) and those that came from neurons with average shape preference for high curvature/“C” (shape preference values between 3 and 4). The correlation distribution of the straight/low curvature sub-population is significantly different from those of the other two sub-populations. Bottom histograms: Distribution of pattern reliability for the same three sub-populations as above. The reliability distributions are not significantly different from each other.

