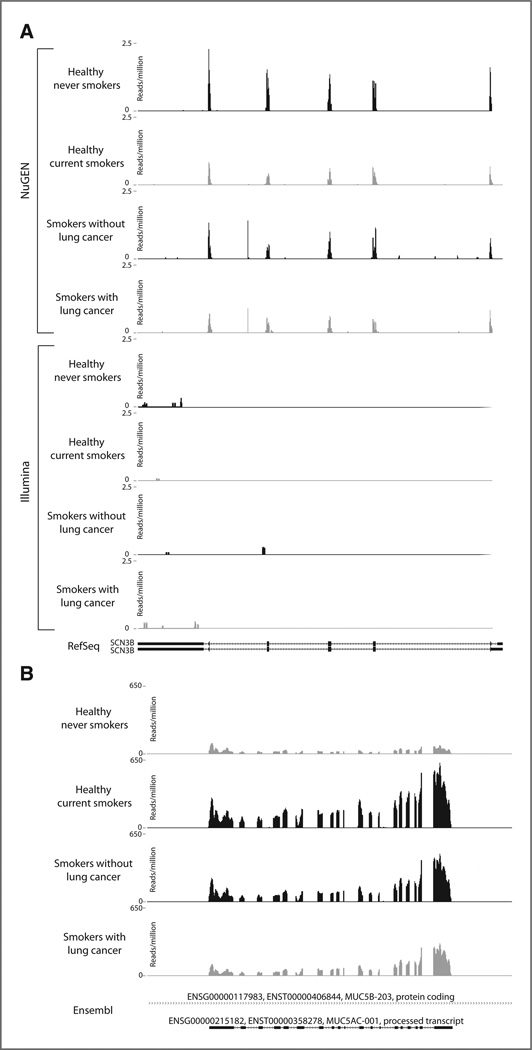
Figure 4.
Read coverage plots of selected genes. For each plot, the reads normalized by the total number of reads (reads per million) are displayed on they-axis and the genomic coordinates are displayed on the x-axis. Within each group (S vs. NS and C vs. NC), the sample with higher expression is shown in black and the sample with lower expression is shown in gray. A, SCN3B (sodium channel, voltage-gated, type III, beta), reads from samples processed using the NuGEN protocol are represented in the top 4 panels and reads from samples processed using the Illumina protocol are represented in the bottom 4 panels. B, MUC5AC (mucin 5AC), reads from samples processed using the Illumina protocol are shown.

