
Fig. 2.
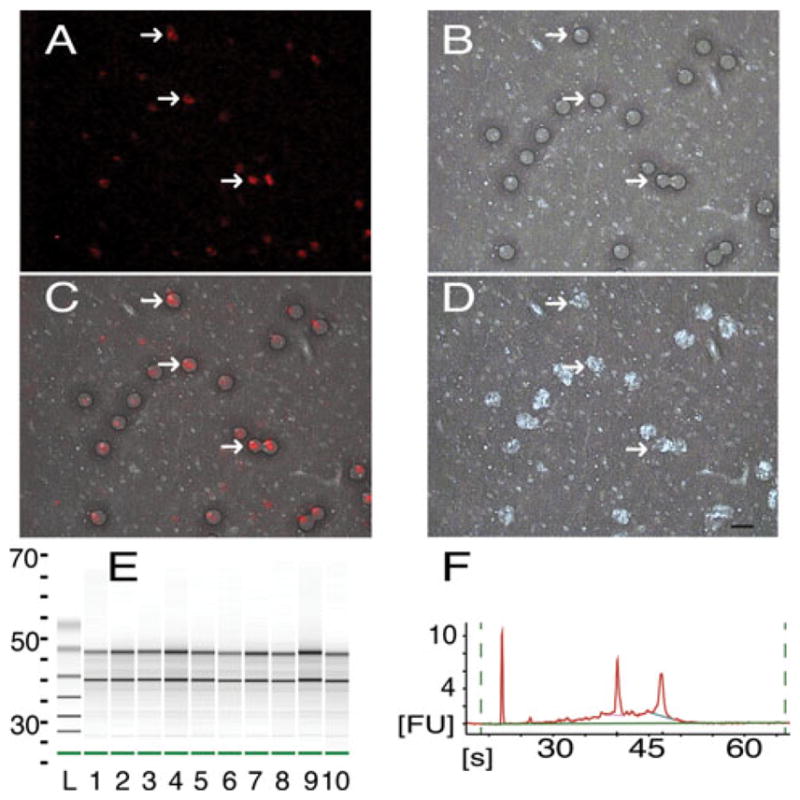
LCM collection and RNA quality verification. a Cortical neurons (red), retrogradely labeled in vivo with CTB647 during the 1st procedure, viewed through the LCM optics at ×40 magnification (same for a–d). White arrows point to the same neurons in a–d. b Brightfield illumination of the same section as a after laser fire showing wetted spots (dark circles) of photoreactive polymer. c Overlap of a and b showing accuracy of wetted spot placement over labeled neurons. d Same section as a after removal of collection cap showing removal of selected tissue (holes appear white). 1,900 neurons were collected from 14-μm thick sections at the level of the RFA. Frames a and c were adjusted for contrast and brightness for easier viewing. Bar is 20 μm (same for a–d). e Electropherogram in gel format of isolated RNA of five samples run in duplicate (lanes 1–5, 6–10) plotted versus run time (s, seconds), standard ladder (L) is included. f Electropherogram of lane 2 from e in native format, run time (s) is plotted versus fluorescence units (FU). Well-defined bands of 18S and 28S rRNA (e black lines, f sharp peaks) are present in high quality samples