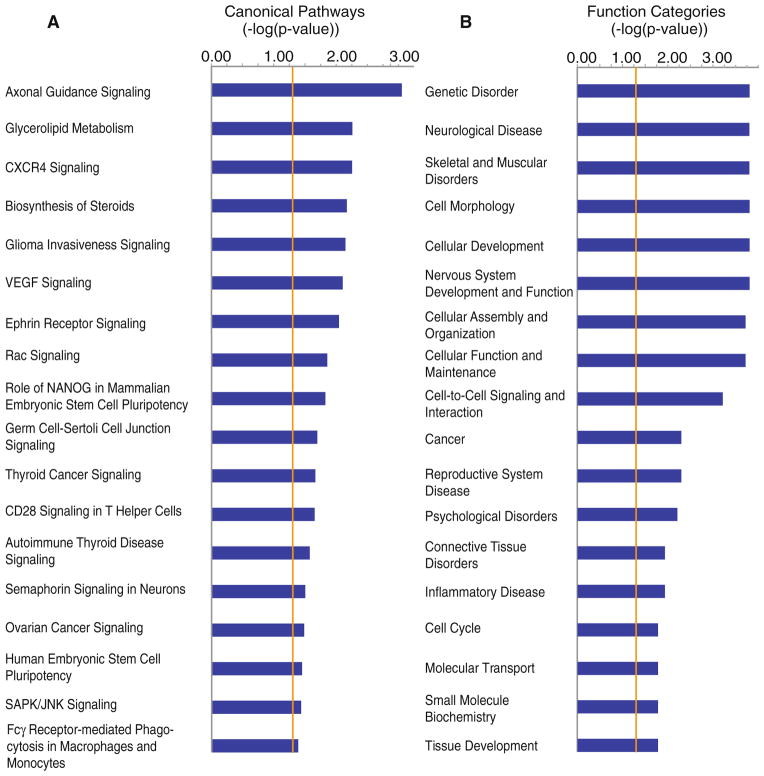
Fig. 4.
Canonical pathways and function categories involving significantly regulated genes from interconnected neurons 7 days post-infarct. a Significantly regulated genes (p <0.05 and above ≥1.3-fold change) were analyzed for interaction of their gene products and fit to canonical pathways developed with a curated gene database using Fisher’s Exact test (IPA software) to determine the probability of the same result when choosing genes at random. The length for each canonical pathway or function (blue box) is the negative log of the p value, and is significant if it extends to the right of the orange threshold line (−log(p ≤ 0.05)). Fisher’s Exact test accounts for the number of uploaded genes, genes in the reference set, genes in the pathway and uploaded genes in the pathway. “Axonal Guidance Singnaling”, has a −log(p) = 2.86. b Significantly regulated genes (p <0.05 and above ≥1.3-fold change) were analyzed for overrepresented biological functions involving their gene products in accordance with a curated gene database using Fisher’s Exact test (IPA software) to determine the probability of the function being overrepresented when choosing genes at random. Box length and threshold line are the same as in a

