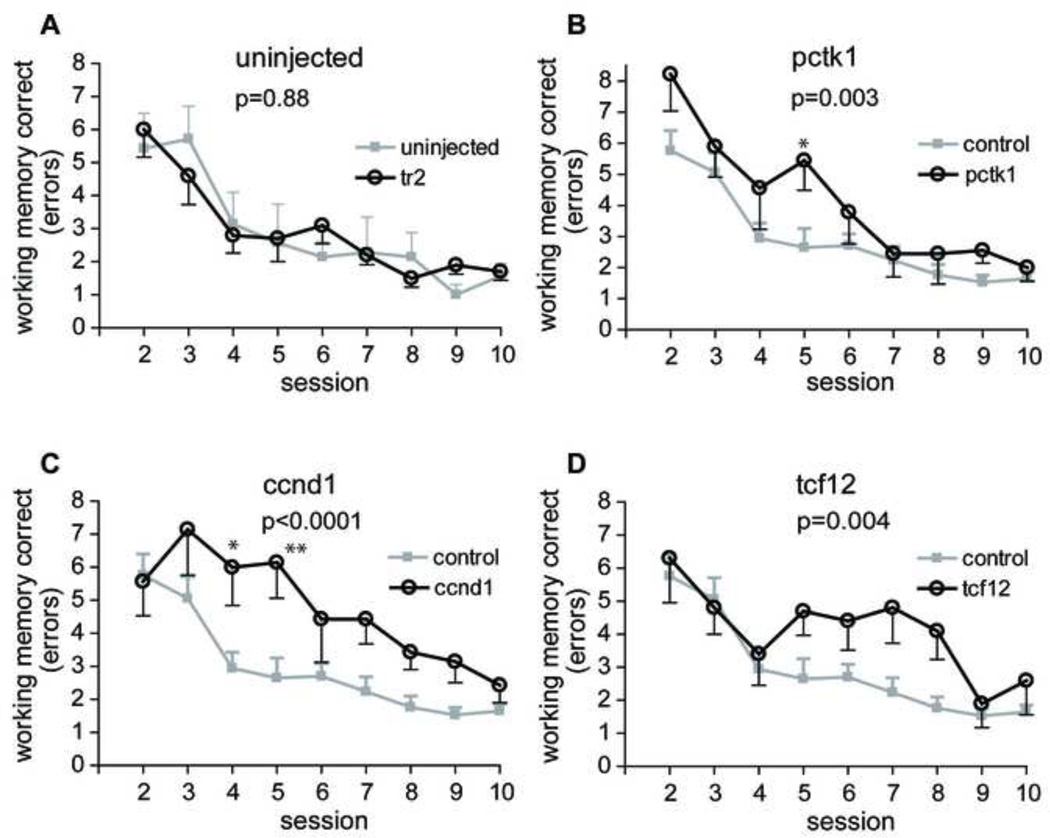
Fig. 4.
Spatial working memory performance in radial arm water maze. Each data point represents the mean ± SEM of spatial working memory correct errors committed in each session. (A) There was no difference between tr2 vector (n = 10) injected and uninjected animals (n = 7). These 2 groups were combined as control group. (B, C, D) Significant differences were found between control animals (n = 17) and Pctk1 (n = 9, panel B), or Ccnd1 (n = 7, panel C), or Tcf12 (n = 10, panel D). Asterisks indicate a significant difference between control and treatment animals on a particular day by Bonferroni post hoc comparison (*, P < 0.05; **, P < 0.01). See text and Table 1 for additional details.

