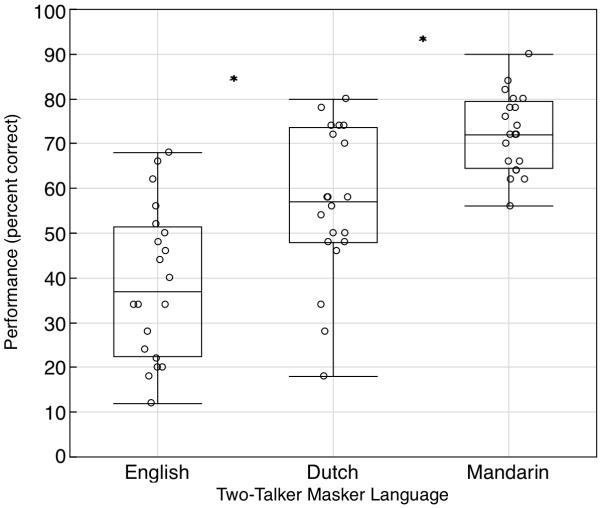
Figure 1.
Sentence recognition performance (percent correct) in the presence of three two-talker maskers spoken in English, Dutch and Mandarin. Boxplots for each linguistic masker are shown. The length of the box indicates the interquartile range of performance scores, while the intermediate horizontal line indicates the median. The whiskers are calculated using the following two formulae: upper whisker = 3rd quartile + 1.5*(interquartile range), lower whisker = 1st quartile − 1.5*(interquartile range). Individual data points are also indicated for all 20 listeners within each boxplot.

