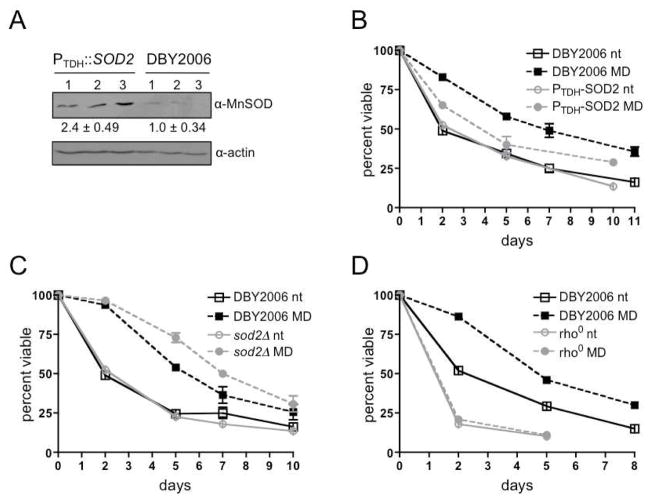
Figure 2. A Mitochondrial Superoxide Signal Extends CLS.
(A) Western blot analysis of Sod2p (MnSOD) in PTDH::SOD2 and wild-type (DBY2006). Samples were collected at an OD600 of 1.0. MnSOD band intensity was normalized to actin, and the DBY2006 protein level was set to one. Values under the blot represent the mean ±SEM for three biological replicates.
(B) CLS in wild-type and PTDH::SOD2 strains following exponential phase treatment with menadione (MD) or ethanol (nt).
(C) CLS in wild-type and sod2Δ strains as in (B).
(D) CLS in wild-type and rho0 as in (B).

