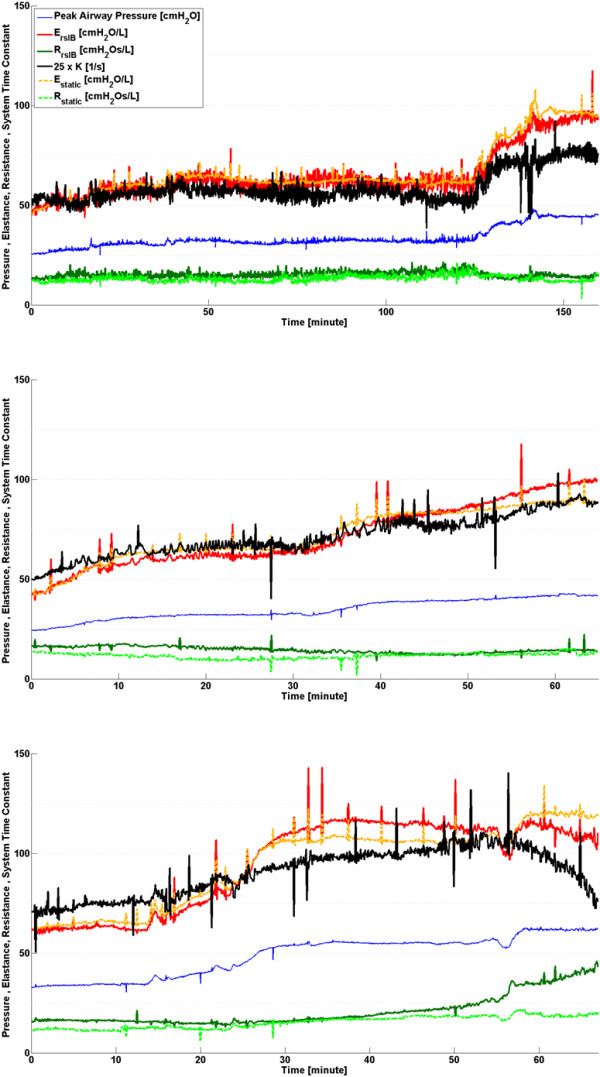
Figure 5.

Respiratory system mechanics monitoring during phase 2, disease progression. Note that values of K have been scaled for clarity and serve only as an indication for trend comparison. Subject 1 (Top), Subject 2 (Middle) and Subject 3 (Bottom).
