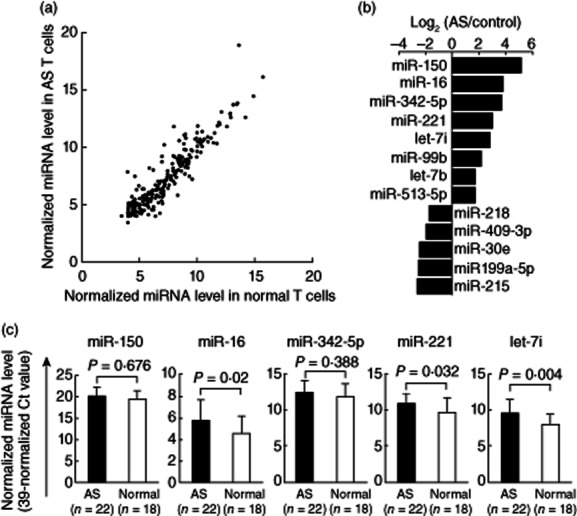
Figure 1.

Comparison of microRNAs (miRNAs) expression in T cells from patients with ankylosing spondylitis (AS) and healthy controls. (a) The expression profile of 270 miRNAs measured by real-time polymerase chain reaction (PCR). Each scatter-spot represents the average of normalized miRNA level in T cells from five AS patients and five healthy controls for each miRNA. The threshold cycle (Ct) is defined as the cycle number at which the change of fluorescence intensity crosses the average background level of the fluorescence signal. The normalized miRNA level was defined as [39 – Ct after normalization with the internal control (U6 small nuclear RNA)]. (b) Eight miRNAs were found potentially over-expressed and five mRNAs were under-expressed in AS T cells (fold change >4·5; P-value < 0·05). (c) The five most potentially differentially expressed miRNAs (defined as fold change >6) were validated further by real-time PCR in T cells from another 22 AS patients and 18 compatible healthy controls. Increased expression of miR-16, miR-221 and let-7i in T cells from AS patients was confirmed after validation.
