Figure 3.

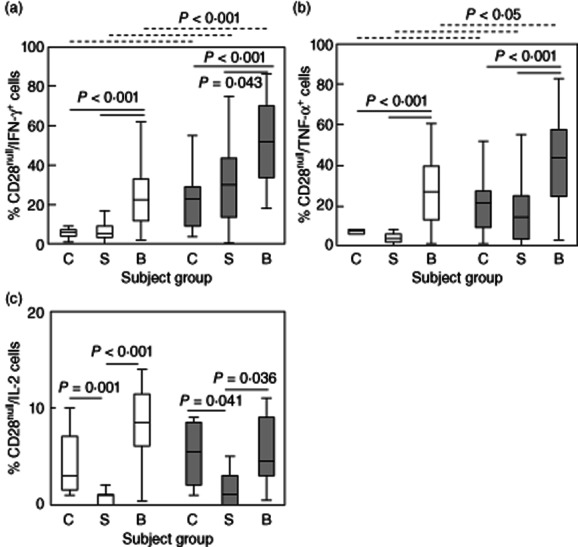
Box-plots showing the percentage of (a) CD28null/interferon (IFN)-γ+/CD4+ (clear bars) and CD28null/IFN-γ+/CD8+ T cells (grey bars) in control subjects (C), stable transplant patients (S) and patients with bronchiolitis obliterans syndrome (BOS) (B). There was a significant increase in the percentage of CD28null/IFN-γ+/CD4+ and CD28null/IFN-γ+/CD8+ T cells in patients with BOS compared with stable transplant patients and controls. There was a significant increase in the percentage of CD28null/IFN-γ+/CD8+ T cells in controls, stable patients and patients with BOS compared with CD28null/IFN-γ+/CD4+ cells (dotted line). (b) CD28null/tumour necrosis factor (TNF)-α+/CD4+ (clear bars) and CD28null/TNF-α+/CD8+ T cells (grey bars) in control subjects (C), stable transplant patients (S) and patients with BOS (B). There was a significant increase in the percentage of CD28null/TNF-α+/CD4+ and CD28null/TNF-α+/CD8+ T cells in patients with BOS compared with stable transplant patients and controls. There was a significant increase in the percentage of CD28null/TNF-α+/CD8+ T cells in controls, stable patients and patients with BOS compared with CD28null/TNF-α+/CD4+ cells (dotted line). (c) CD28null/IL-2+/CD4+ (clear bars) and CD28null/IL-2+CD8+ T cells (grey bars) in control subjects (C), stable transplant patients (S) and patients with BOS (B). There was a significant decrease in the percentage of CD28null/IL-2+/CD4+ and CD28null/IL-2+/CD8+ T cells in stable transplant patients compared with controls. There was a significant increase in the percentage of CD28null/IL-2+/CD4+ and CD28null/IL-2+/CD8+ T cells in patients with BOS compared with stable transplant patients.
