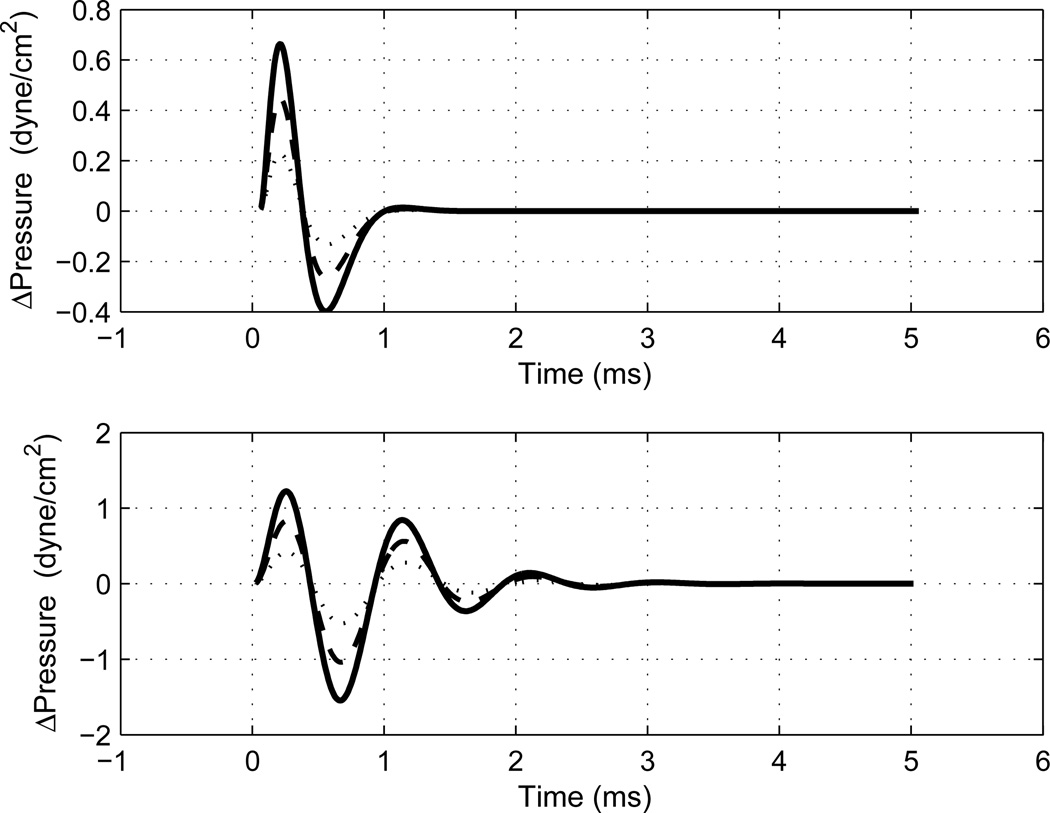
Fig. 11.
[grey-scale, EPS]. The click-difference waveforms are plotted that were generated by a time-domain simple-harmonic oscillator model of middle-ear response, including the round-trip travel time in an ear canal with cylindrical dimensions, based on an input signal with the same impulse strength as the measured click stimulus. Top: results modeling the measured adult-ear response in Fig. 2 (bottom). Bottom: results modeling the measured infant-ear response in Fig. 3 (bottom). Modeling results are shown for three stiffnesses, with the thickest solid line corresponding to the largest stiffness.

