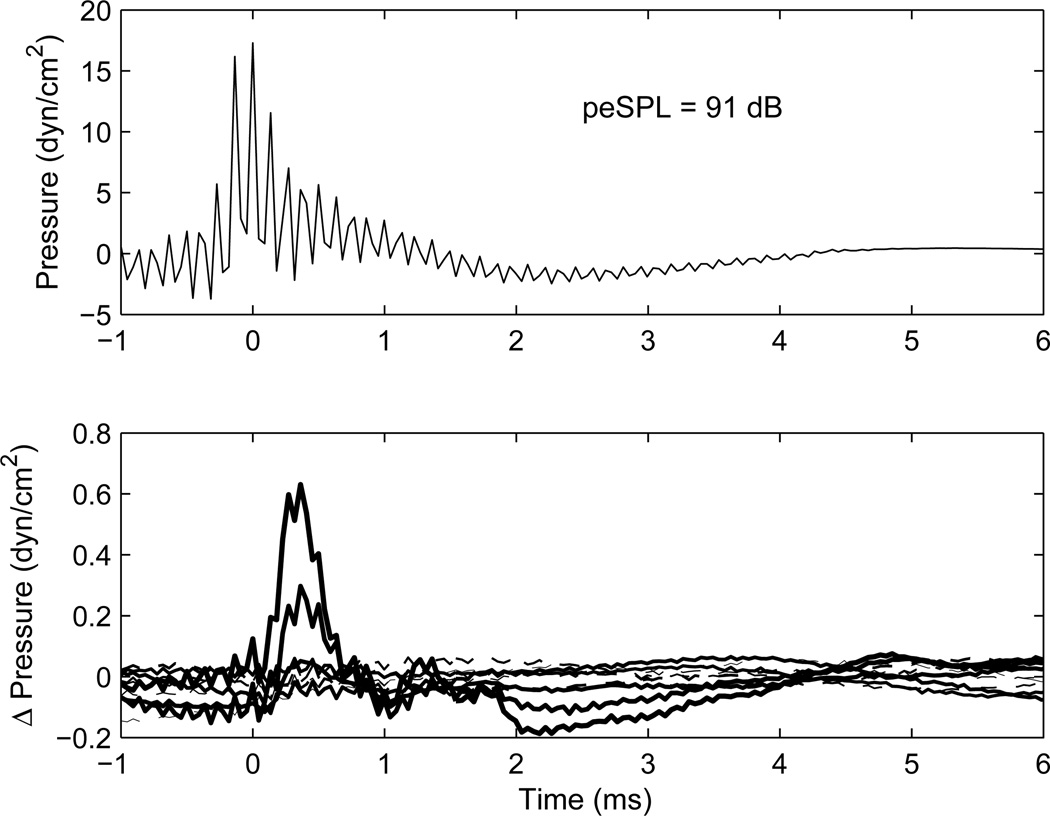
Fig. 2.
[grey-scale, EPS]. The waveform response in an ear of an adult to the initial click is shown in the top panel, for which the peSPL in the ear was 91 dB. Time t=0 ms is located at the maximum amplitude of the click stimulus. The click difference waveform response (final click minus initial click) is shown in the bottom panel at each of the 10 BBN activator levels, with increasing line thickness corresponding to increasing activator level. The click differences for the 5 lower-level activators are plotted with dashed lines, and those for the 5 high-level activators are plotted with solid lines. Each click difference response is the average across the two repetitions at each activator level.

