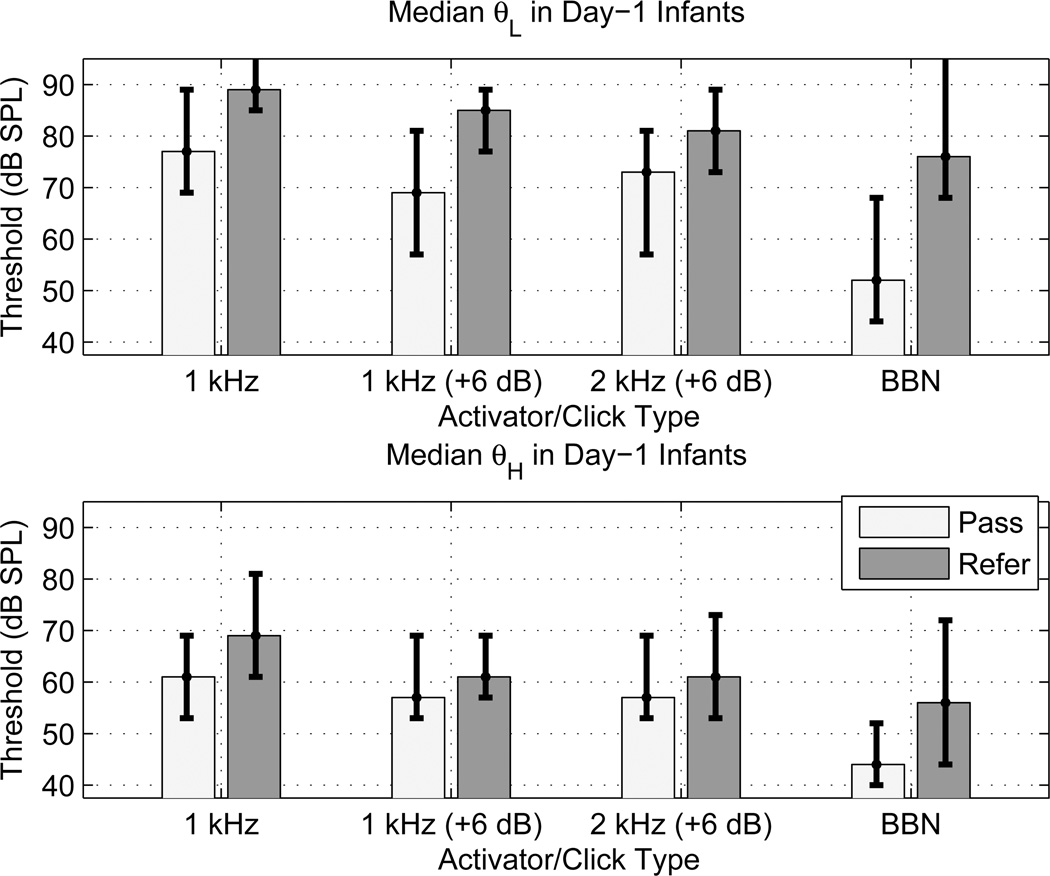
Fig. 8.
[grey-scale, EPS]. The median ARTs (in dB SPL) measured in the Day-1 newborn group of pass and refer ears are plotted as bars for each activator type for θL (top panel) and θH (bottom panel). The associated IQRs are shown by the error bars. The ipsilateral activator types include the 1 kHz tonal activator at the reference click level and at a level 6 dB higher than the reference (denoted 1 kHz and 1 kHz (+6 dB), respectively), the 2 kHz tonal activator at a level 6 dB higher than the reference (denoted 2 kHz (+6 dB)), and BBN. The upper error bar extends above the plotting range for θL in the refer group at 1 kHz and BBN because the 75th percentile was an absent AR at every activator level.

