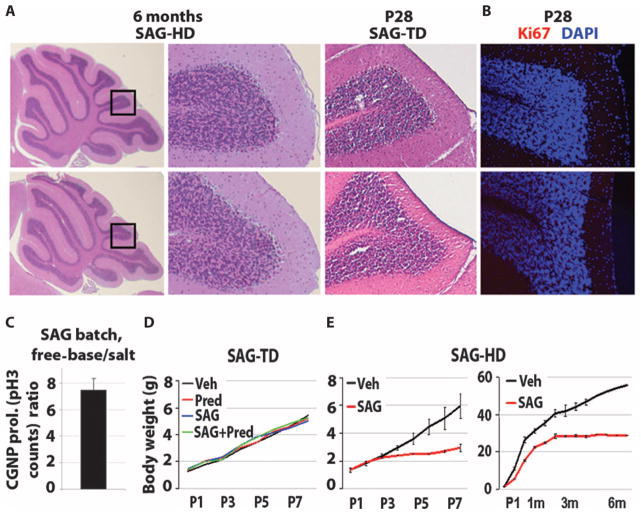
Fig. 3.
Results of toxicity studies with SAG at treatment and high doses. (A) Histological analysis of the cerebella of the 6-month-old control and SAG-HD (SAG high dose), and P28 control and SAG-TD (SAG treatment dose)–treated animals. (B) Immunocytochemistry for the proliferation marker Ki67 in the cerebella of P28 control and SAG-TD–treated animals. DAPI, 4′,6-diamidino-2-phenylindole. (C) Determination of treatment and high dose of SAG using CGNP proliferation in vitro. Histogram represents the ratio of the number of pH3-positive cell cultures using free-base SAG versus the salt form of SAG at 1 nM (n = 2). (D and E) Growth curves of vehicle, SAG-TD, prednisolone, prednisolone + SAG-TD (D), and SAG-HD–treated (E) mice.

