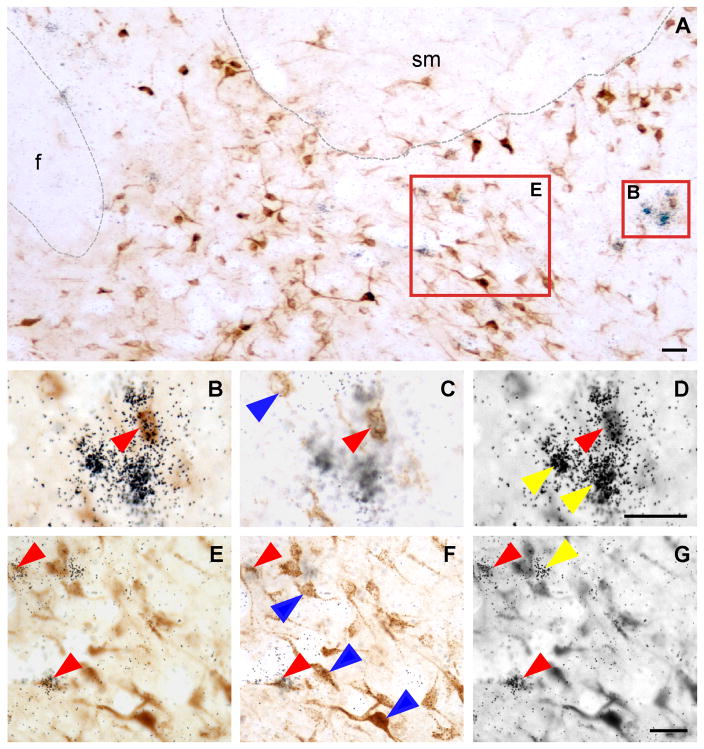
Fig. 5.
A. Bright-field photomicrograph showing FG-positive cells (dark brown color cells) and Ucn 3 mRNA-positive signals (black dot clusters) in the posterior part of the BNST. B,E: High power magnification of boxed areas in A showing colocalization of FG immunoreactivity and Ucn 3 mRNA signals. C, D, F, G: Photomicrographs of B (C, D) and E (F, G) at different focal planes showing FG-positive cells (C, F) and Ucn 3 mRNA signals (silver grain clusters, D, G). Representative double-labeled cells are indicated by red arrowheads. Representative single-labeled FG-positive cells in C and F are indicated by blue arrowheads and representative single-labeled Ucn 3 mRNA-positive cells in D and G are indicated by yellow arrowheads. f: Fornix, sm: Stria medullaris of thalamus. Scale bar: 25 μm.

