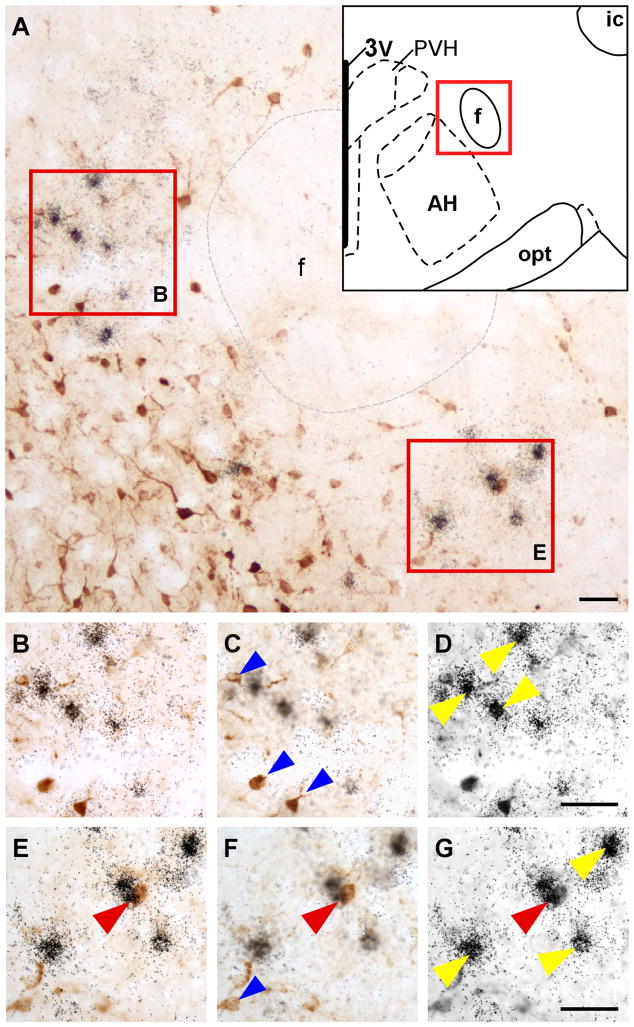
Fig. 7.
A: Representative low power photomicrograph showing FG-positive cells (dark brown color cells) and Ucn 3 mRNA signals (black dot clusters) in the rostral PFH indicated by the schematic drawing in the inset. B,E: High power magnification of boxed areas in A showing FG immunoreactivity (brown color cells) and Ucn 3 mRNA signals (silver grain clusters). Note that very few double-labeled cells were observed in this area. C, D, F, G: Photomicrographs of B (C, D) and E (F, G) at different focal planes showing FG-positive cells (C, F) and Ucn 3 mRNA signals (silver grain clusters, D, G). A double-labeled cell is indicated by red arrowhead. Single-labeled FG-positive cells are indicated by blue arrowheads and single-labeled Ucn 3 mRNA-positive cells were indicated by yellow arrowheads. 3V: Third ventricle, AH: anterior hypothalamus, ic: Internal capsule, f: Fornix, PVH: paraventricular nucleus of hypothalamus, opt: Optic tract. Scale bar: 100 μm (a), 50 μm (b).

