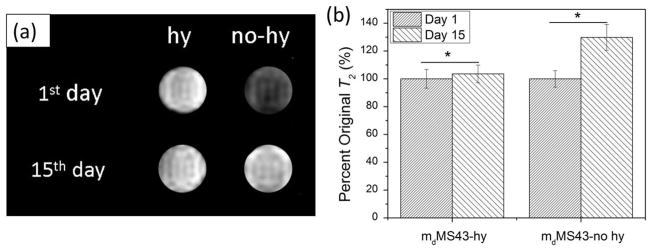
Figure 10.

MRI data for mdMS43-no hy and mdMS43-hy samples over 15 days of aging in DI water. (a) T2 weighted images show an increase in T2 over time for samples without hydrothermal treatment while those with hydrothermal treatment remain stable. (b) Percent of original T2 values calculated from T2 maps (n=81 for each condition). The increase in T2 values for samples without hydrothermal treatment is consistent with measurements obtained by relaxometry. * indicates p<0.05.
