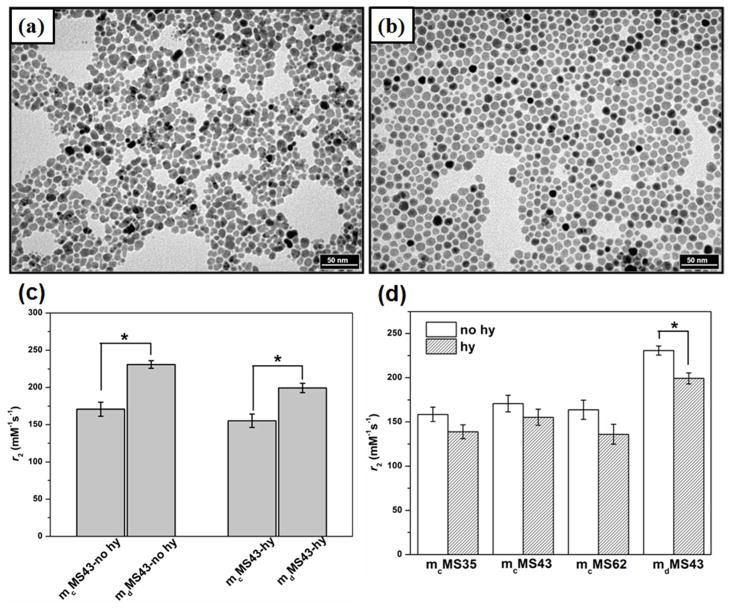
Figure 4.
TEM images of (a) co-precipitation Fe3O4 NPs (mc) and (b) thermal decomposition Fe3O4 NPs (md), scale bar = 50 nm. Despite differences in diameter distributions, the SPIONs present in mMS NPs have diameters which center on 9–10 nm and allow a reasonable comparison between the two (see Table 1). (c) Effect of core synthesis on r2 of mMS43-no hy and mM43-hy NPs. (d) r2 value comparison for mcMS and mdMS NPs with and without hydrothermal treatment. * represents p < 0.05.

