


FIGURE 5.
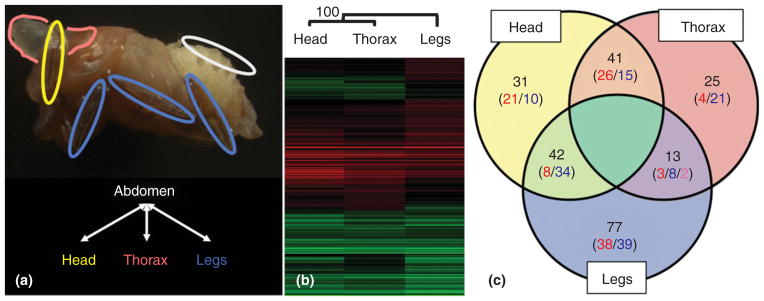
Example of a microarray study in horned beetles designed to identify similarities and differences in gene expression profiles between developing head horns, thoracic horns, and legs of the horned beetle O. taurus. (Reprinted after Ref 22. Copyright 2010 Armin Moczek). (a) Microarray experimental design. The pupal tissues used in this study are indicated in the upper panel, whereas the general array hybridization scheme is illustrated in the lower panel. Head horn (head), thoracic horn (thorax), and legs are labeled yellow, pink, and blue, respectively. RNA from each tissue was competitively hybridized with RNA from abdominal epithelium (abdomen, white). (b) Hierarchical clustering of differentially expressed genes indicates an overall high level of similarity in gene expression patterns between developing head and thoracic horns and, to a slightly lesser degree, legs. 1367 spots showed significant and differential expression, and are shown clustered based on their M-values when compared to abdominal epithelium. Each row represents a single spot and each column represents the sample. Relative magnitude of gene expression level is indicated by color brightness; red indicates enriched compared to abdominal epithelium whereas green indicates depleted relative to abdominal epithelium. Bootstrap value was obtained after 5000 trials. Branch lengths represent relative distances between the samples. (c) Categorization of genes that exhibited significantly differential expression, illustrating the unique components of head- and thoracic horn transcriptomes. Significant differential expression was defined by a P-value < 0.05 and > twofold difference in expression levels. Labels on each category represent tissue types (head = head horns, thorax = prothoracic horns, and legs = legs). Numbers indicated in the Venn diagram represent counts of non-redundant sequences in each category. Numbers in parentheses indicate counts of sequences that showed enriched or depleted expression relative to abdominal epithelium, where: red = enriched, blue = depleted, and pink = mixed (i.e., enriched in thoracic horns and depleted in legs).