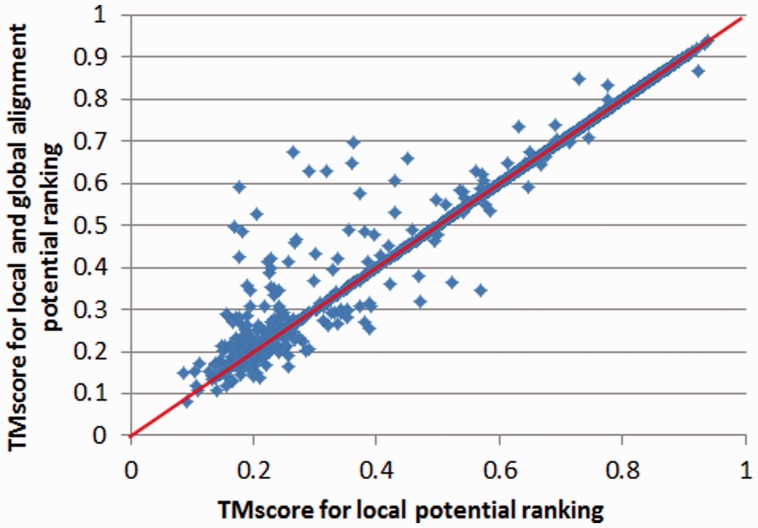
Fig. 6.
Contribution of the distance-based pairwise alignment potential to Set 1000 × 6000. Each point represents the quality, measured by TM-score, of two models: one is generated using the local alignment potential only (x-axis), and the other using both the local and global alignment potentials (y-axis)

