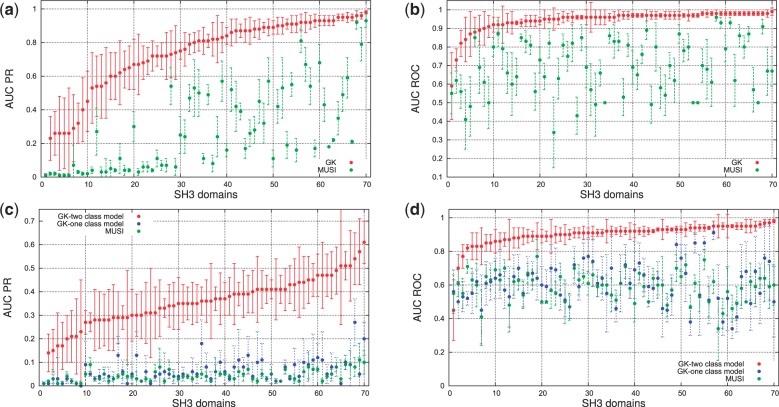
Fig. 3.
A 10-fold cross-validation performance. (a) + (b) comparison when using filtered negative interactions for Graph Kernel (GK) and MUSI. (c) + (d) comparison with nonfiltered negative interactions for binary class Graph Kernel (GK), one-class Graph Kernel and MUSI. The error bars represent respective standard deviation. The domains are sorted by increasing average performance for the Graph Kernel method

