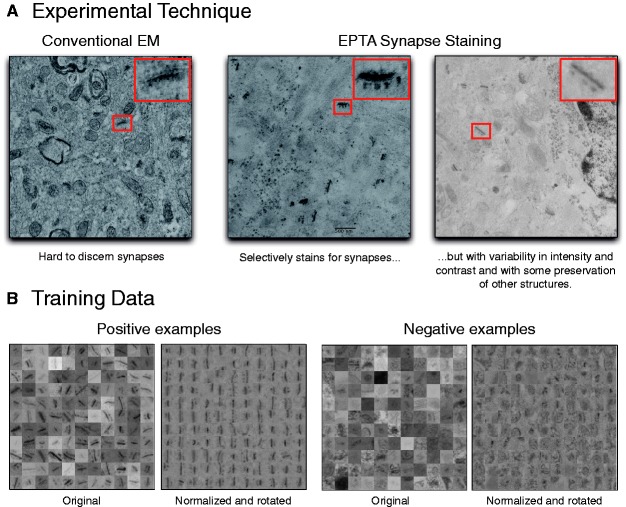
Fig. 1.
Experimental technique and training data collected. (A) Comparison of conventional and EPTA-stained EM images shows a marked difference in clarity of synaptic structures, albeit high sample-to-sample variability. (B) Subset of positive and negative examples taken from multiple images across all samples. The original examples exhibit high variance and noise; normalization and alignment reduces this heterogeneity

