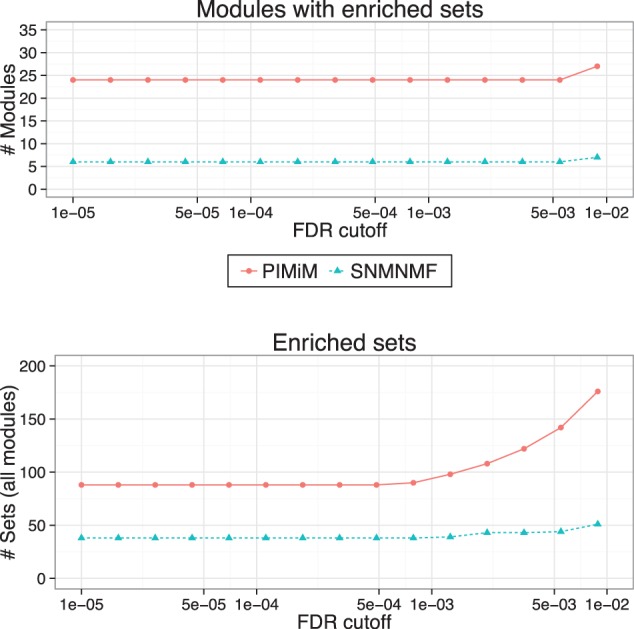
Fig. 3.

MSigDB enrichment analysis: pathway enrichment analysis was done using 880 gene sets of canonical pathways (C2-CP) from MSigDB (Subramanian et al., 2005). P-values were computed using hypergeometric test (with 10 000 random permutations) on the intersection of the set of genes in each module with MSigDB gene sets. Benjamini–Hochberg procedure was used to control the false discovery rate. Top: Number of modules significantly enriched for at least one MSigDB category for different significance cut-offs. Bottom: Number of MSigDB categories identified as in enriched in at least one of the modules for different significance cut-off
