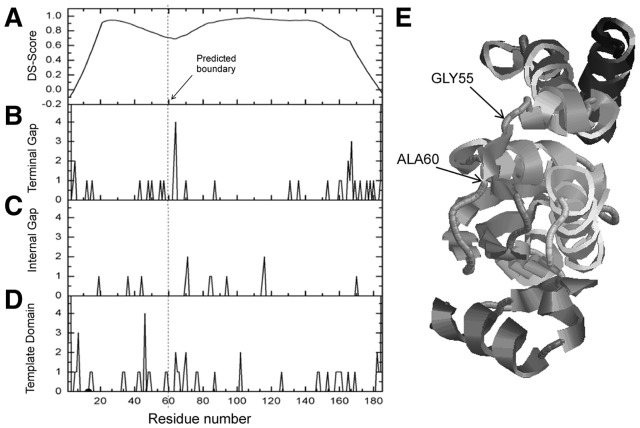
Fig. 4.
An illustrative example of ThreaDom prediction on ‘Hard’ target from the GTP cyclohydrolase I (PDB ID: 1wurA). (A) DCS score distribution. (B–D) Counts of templates with terminal gap, internal gap and template domain assignment along the sequence in the total 50 selected templates. (E) X-ray structure of the target protein with CATH and ThreaDom domain boundaries labeled

