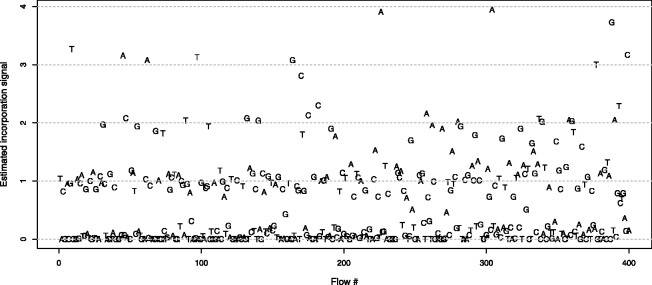
Fig. 2.

Typical flowgram. We show the normalized and phase-corrected signal of a single flowgram. The actual nucleotide in each flow is indicated by the appropriate letter. Ideal signals are expected to be integers, indicating exactly how many nucleotides were incorporated during each flow. However, the actual signal at each flow is noisy, and the noise increases as the sequencing process advances
