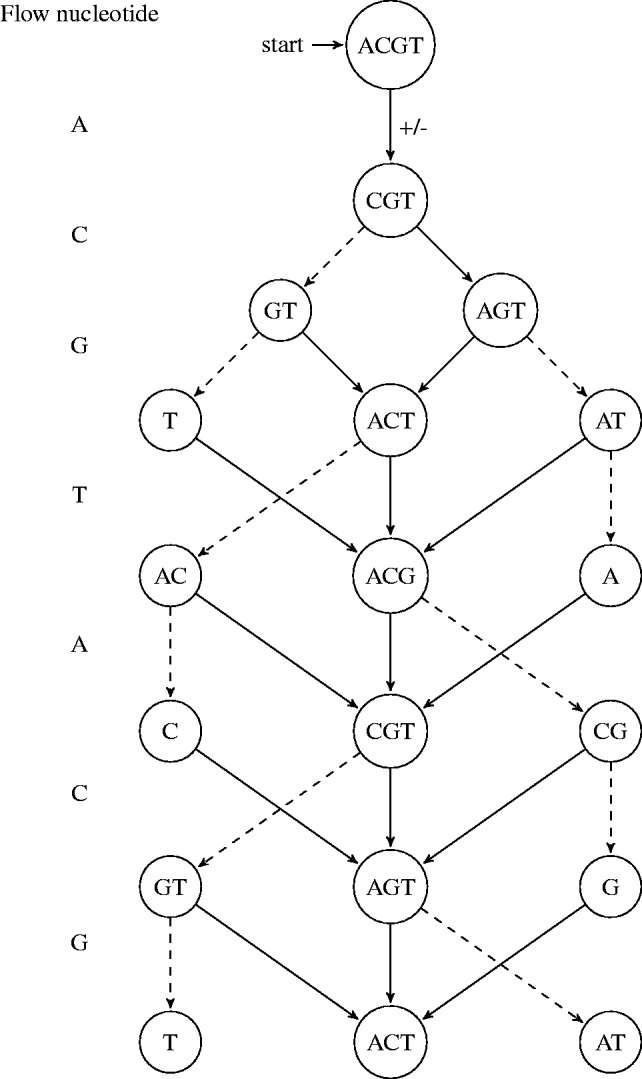
Fig. 3.

Illustration of state machine transitions. In this example, the flow is composed of repetitions of the wash cycle ACGT and the state machine starts from the state {A,C,G,T}. Each layer of the figure illustrates the possible states at that flow index. Incorporation and no incorporation transitions are marked by solid and dashed edges, respectively. Note that nodes with a single nucleotide dictate incorporation in the next flow and have no outgoing dashed edges
