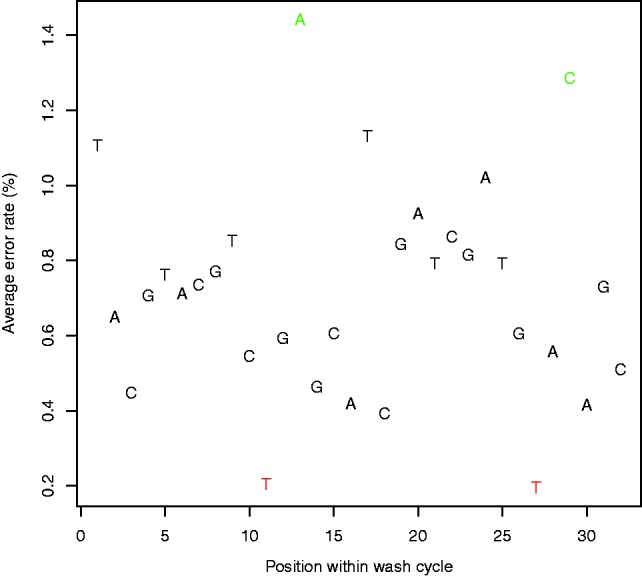
Fig. 4.

Dependence of error rate on wash cycle. Average error rates along the 32-nt long wash cycle, for the rounding method. The actual nucleotide in each flow is indicated by the corresponding letter. We used the first 320 flows to calculate the rates and discarded the first cycle to cancel the effect of the sequencing adapter. Note the high dependence of the error rate on the position in the wash cycle—positions 13 and 27 (colored red) display a considerably low error rate, whereas positions 11 and 29 (colored green) display a considerably high error rate. These changes in error rate can be partially explained by patterns in the wash cycle
