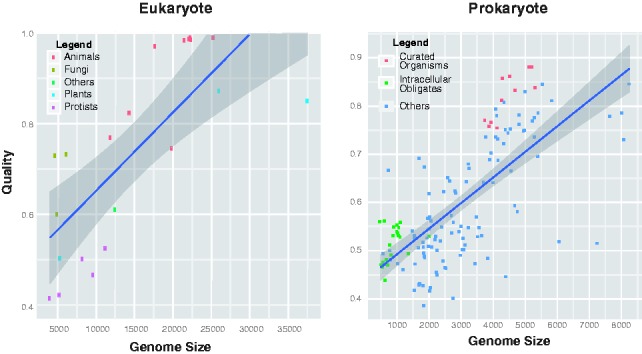
Fig. 4.

Variation of predicted annotation quality with genome size. Left: Scatter plot showing predicted annotation quality against genome size in eukaryotes: species are classified as animals, fungi, plants, protists and others. Right: Scatter plot showing predicted annotation quality against genome size in prokaryotes: orange—well-studied species (E.coli strains and the closely related species Salmonella and Yersinia); green—intracellular obligate species. The shaded region shows the 95% confidence interval for the regression line
