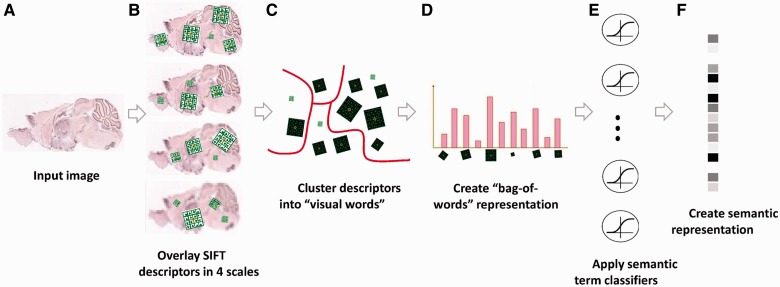
Fig. 2.
Illustration of the image processing pipeline. (A) Original image in pixel grayscale indicating level of gene expression. (B) Local SIFT descriptors are extracted from image at 4 resolutions. (C) Descriptors from all 16351 images are clustered into 500 representative ‘visual words' for each resolution level using k-Means. (D) Each image is represented as a histogram counting the occurrences of visual words. (E) L2-regularized logistic regression classifiers are applied for 2081 GO categories. (F) The final 2081 dimensional image representation

