
Fig. 2.
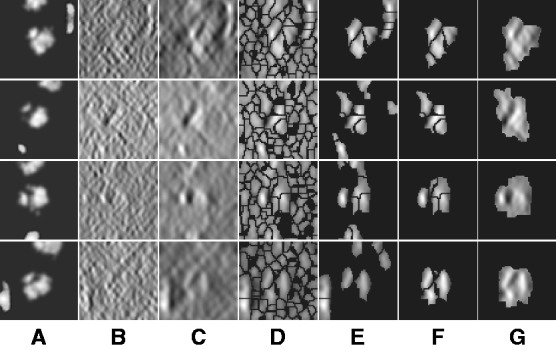
Four typical examples for target complex segmentation based on simulated data. Each row is an example, whereas each subfigure is a slice through the x-z plane in the 3D image. (A) Ground truth. (B) Simulated subtomograms at SNR 0.005 and tilt angle range  (Section 3.1). (C) After Gaussian smoothing with automatic scale selection. (D) After Watershed segmentation. (E) After boundary segment detection. (F) Selected segment cluster from model based clustering. (G) Detected target complex regions