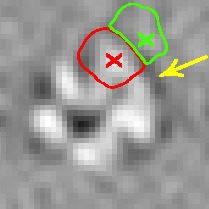
Fig. 3.

A subtomogram’s image features. The boundary feature is a surface that has strong negative intensity (yellow arrow). A local maxima in  is highlighted by a red cross, which is inside the macromolecular complex. Its corresponding structural boundary segment is highlighted by a red circle. A local maxima in
  is highlighted by a green cross, which is inside a background region. Its corresponding background boundary segment is highlighted by green circle. See Section 2.1.2 for the details of these two types of local maxima
