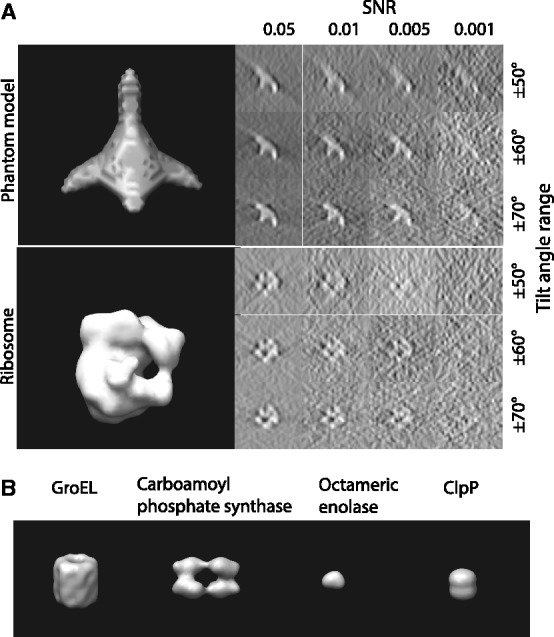
Fig. 4.

Structures used for simulating the tomographic image process. (A) Top: a phantom model that consists of four elliptical Gaussian functions as branches and one spherical Gaussian function to connect the elliptical functions. Bottom: Ribosome complex (PDB ID: 2AW7, 2AWB). Left: isosurface of the two structures. Right: Slices of the corresponding x-z plane in the simulated tomograms with different degree of distortions, i.e. different SNRs and tilt angle ranges. (B) The isosurfaces of four additional benchmark complexes (Xu et al., 2012)
