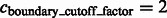
Fig. 7.
Segmentation of target complex regions in Leptospira interrogans subtomograms. Each row shows the segmentation process for a ribosome instance. Each subfigure in a row consists of the consecutive slices through the y-axis of the 3D image. (A) Original extracted subtomograms. (B) Images after Gaussian smoothing with automatic scale selection. (C): Images after Watershed segmentation. (D) Images after structural boundary segment detection. (E) Images of the selected segment clusters resulting from the model-based clustering. (F) Images of the final segmented target complexes. Because the contrast is low, for the detection of significant boundary segments, we relaxed significance level parameters by setting  . When determining the target complex region, we set