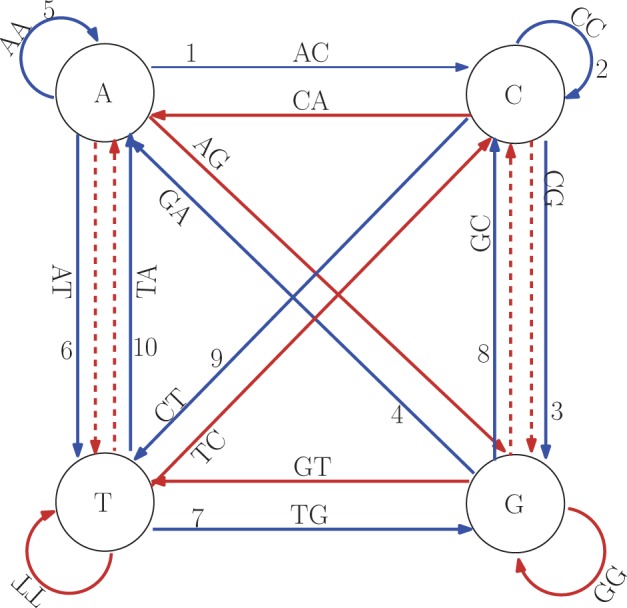
Fig. 3.

An augmented de Bruijn graph of order 1 and an example of forward and reverse paths in it. The dashed edges are added edges. The blue and brown paths represent the forward and reverse paths, respectively. Numbers on edges are the order of the edges in the forward path. The sequences are ACCGAATGCT and AGCATTCGGT for forward and reverse paths, respectively
