
Fig. 2.
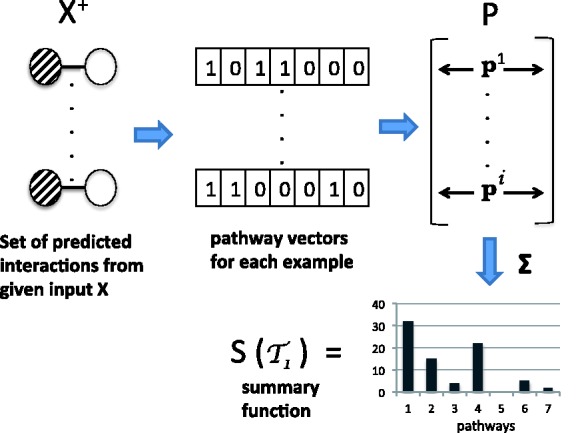
A schematic illustrating the pathway summarizing function S for a task  . On the left are the examples from the input predicted to be positive, indicated by
  . The matrix P has the pathway vectors for each example in
  . The summary function aggregates the pathway vectors to get the distribution