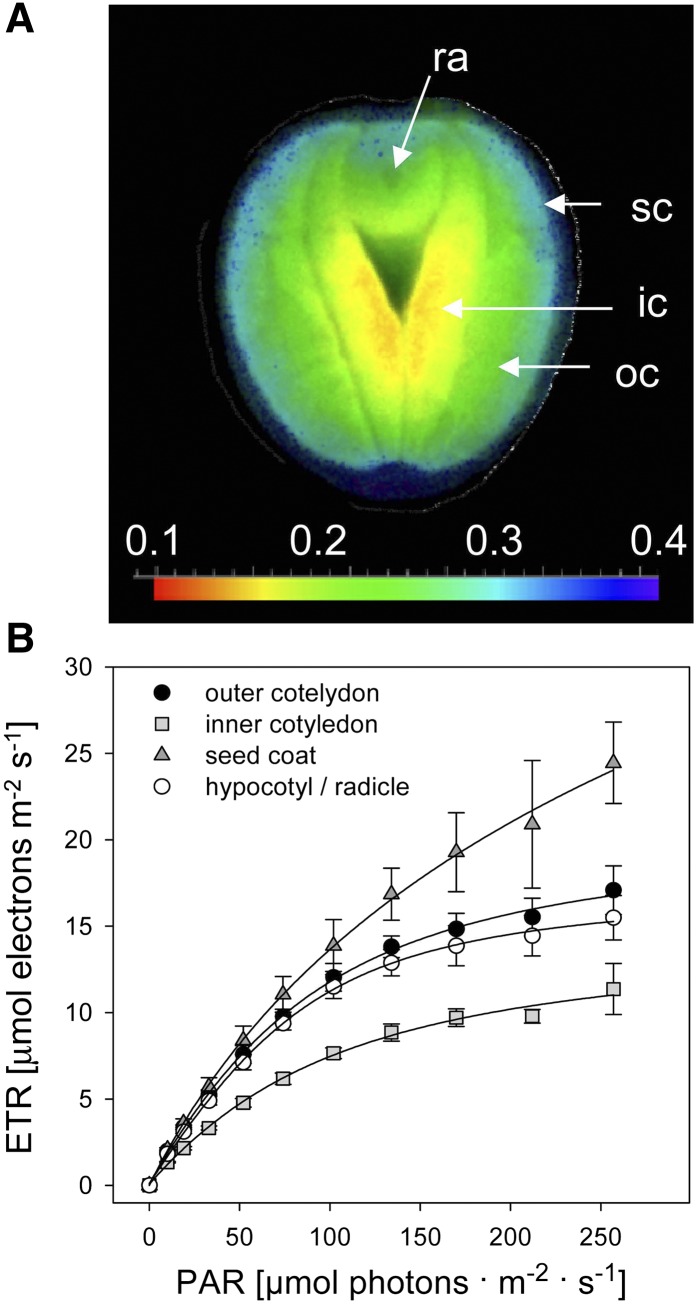
Figure 2.
Gradients in Seed Photosynthesis as Measured by the Imaging-PAM Chlorophyll Fluorometer.
(A) Color-coded map of the effective quantum yield of photosystem II measured at 23 µmol quanta per m2 per second, showing the distribution of photosynthetic capability across the seed.
(B) Rapid light response profiles of the photosynthetic ETR in distinct regions of the seed. Each data point represents the mean ± sd (n = 5). ic, inner cotyledon; oc, outer cotyledon; ra, radicle; sc, seed coat.

