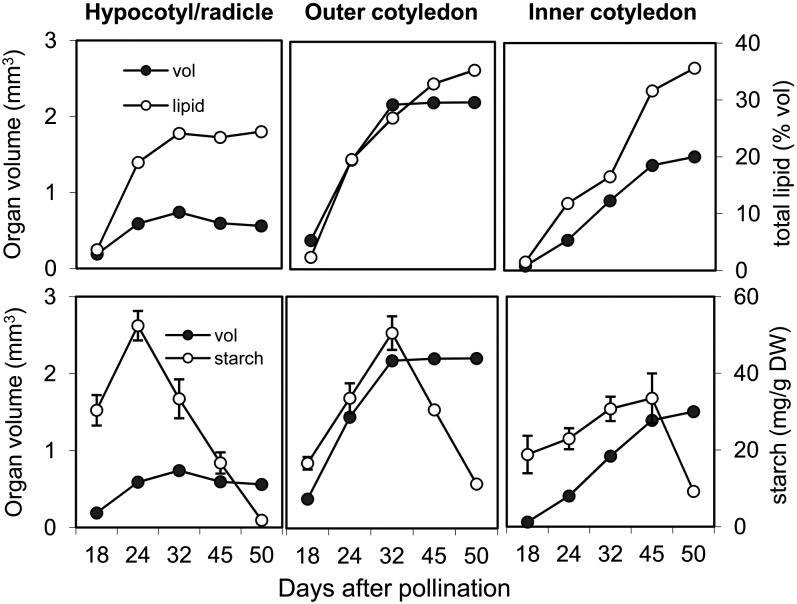
Figure 4.
Temporal Pattern of Lipid and Starch Accumulation in Various Embryo Components in Relation to Their Volume.
Top panels: lipid concentration versus component volume; bottom panels: starch concentration versus component volume. Error bars indicate sd (n = 6). The MRI model used for calculation of lipid/volume ratios at mid storage stage is given in Supplemental Movie 4 online. DW, dry weight.

