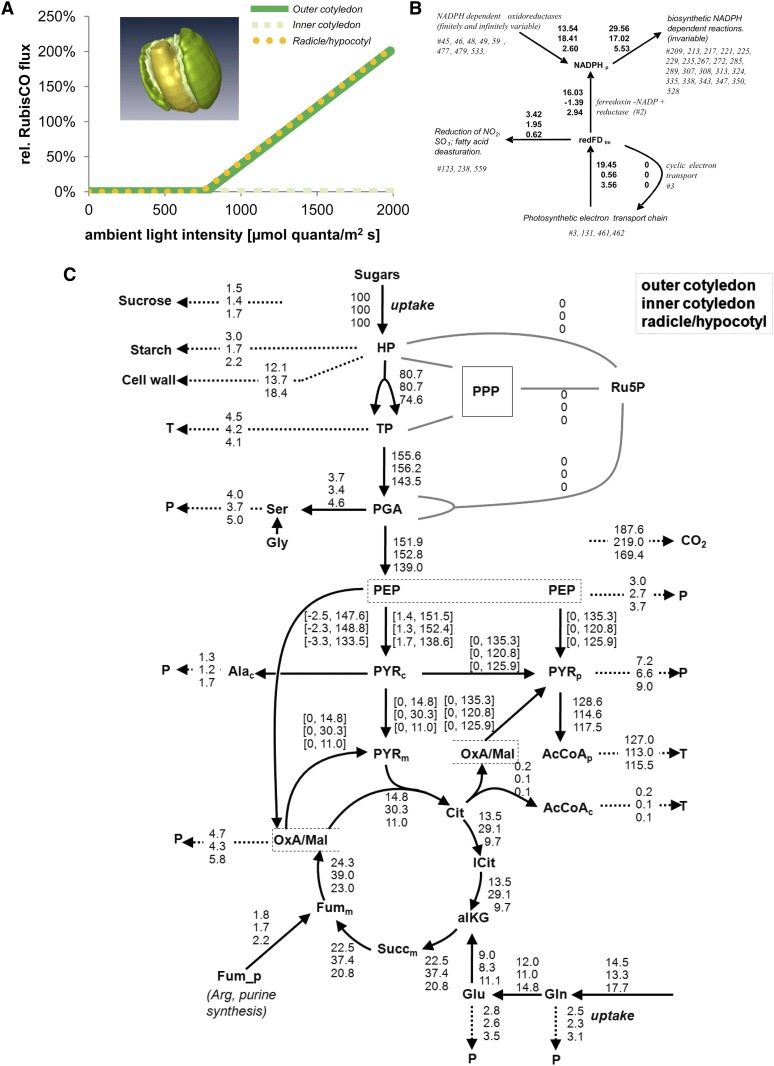
Figure 6.
Simulation of Component-Specific Metabolism in the Oilseed Rape Embryo.
(A) Relative flux through Rubisco.
(B) Plastidial reducing equivalents (NADP and ferredoxin, redFD) redox balance in the outer cotyledon, inner cotyledon, and radicle (from top to bottom) at a simulated illumination level of 400 µmol quanta m−2 s−1. Each component is indicated by a specific color. All influxes and effluxes are shown, as derived from flux values of all reactions that share NADPH_p and redFD_tm. To assess the contribution to plastidial synthetic processes of photosynthetic electron transport, the principal electron sources and sinks were first defined and their combined electron flows derived. The identified producers were photosynthetic electron transport (photosystem I, #461) and various plastidial NADP-dependent oxidoreductases (Glu synthase, #45; Glu dehydrogenase, #46; malate dehydrogenase, #48; malic enzyme, #49; glyceraldehyde-3-phosphate dehydrogenase, #59; Glc-6-phosphate dehydrogenase, #477; phosphogluconate dehydrogenase, #479; isocitrate dehydrogenase, #533).
(C) Metabolic fluxes within each embryo component (from top to bottom: outer cotyledon, inner cotyledon, and radicle/hypocotyl) scaled on the basis of its sugar uptake rate (=100%). Arrowheads denote the direction of net flux. Dashed arrows represent the summed fluxes into protein (P) or triacylglycerol (T). For details, see Supplemental Data Set 3 online (table “B normalized fluxes”).

