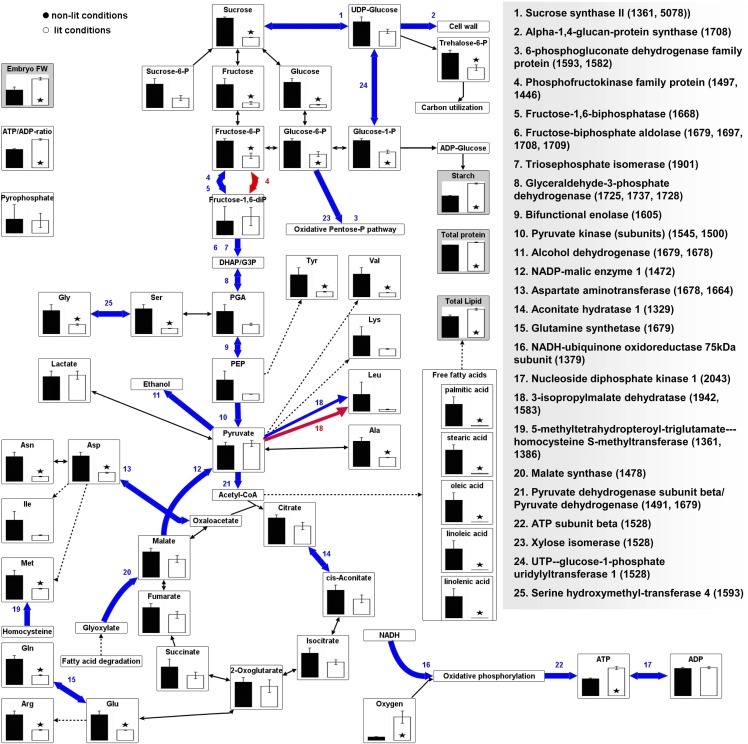
Figure 8.
Proteomic and Metabolomic Response of the Oilseed Rape Embryo to Illumination.
Changes in protein abundance are indicated in blue (upregulated under nonlit conditions) and red (upregulated under lit conditions). Steady state metabolite levels are given as means ± se (n = 5). Asterisks indicate statistically significant (P < 0.05) differences according to a t test. Raw proteomic and metabolomic data are given in Supplemental Data Sets 5 and 6 online. DHAP, dihydroxyacetone-phosphate; FW, fresh weight; PGA, phosphoglycerate; PEP, phosphoenolpyruvate.

