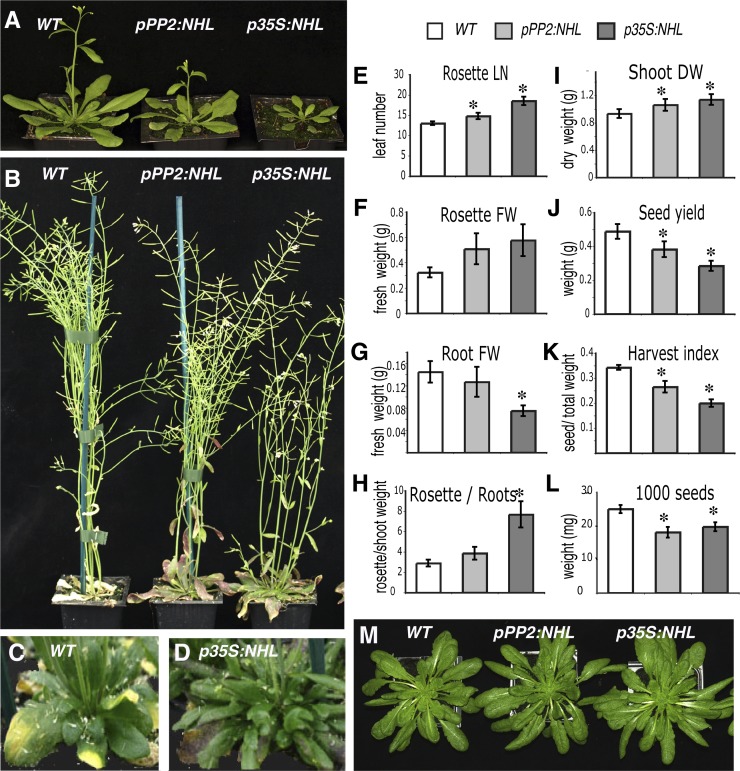
Figure 3.
Growth Defects in NHL26-Overexpressing Lines.
(A) to (D) Phenotype of NHL26-overexpressing plants, grown in long-day conditions. WT, the wild type.
(A) and (B) Plants grown in a growth chamber (16 h day, 150 µE s−1 m−1).
(A) Four-week-old plants.
(B) Eight-week-old plants.
(C) and (D) Ten-week-old plants grown in greenhouse.
(C) The wild type.
(D) p35S:NHL plants displayed no sign of senescence at the time at which the wild type started to senesce.
(E) to (L) Comparison of growth parameters between the transgenic pPP2:NHL and p35S:NHL plants and wild-type plants. Asterisks indicate values significantly different in a t test (P < 0.05).
(E) Number of rosette leaves at flowering time (LN). Error bars indicate the se (n = 12).
(F) to (H) Fresh weight (FW) of the rosette and root of plants grown in pots containing sand in the greenhouse.
(F) Rosette fresh weight.
(G) Root fresh weight.
(H) Rosette FW to root FW ratio. Error bars indicate the se (n = 12).
(I) to (L) Yield parameters for plants grown in long-day conditions in the greenhouse. Asterisks indicate values that are significantly different, as assessed in a t test (P < 0.05).
(I) Dry weight (DW) of shoots (rosette and stem) at harvest time.
(J) Seed weight.
(K) Harvest index, calculated as the ratio of seed weight to dry weight of the aerial part of the plant (rosette, stem, and seeds).
(L) Weight of 1000 seeds. Error bars indicate the se (n = 11).
(M) Ten-week-old plants grown in short-day conditions (8 h day, 150 µE s−1 m−1).
[See online article for color version of this figure.]

