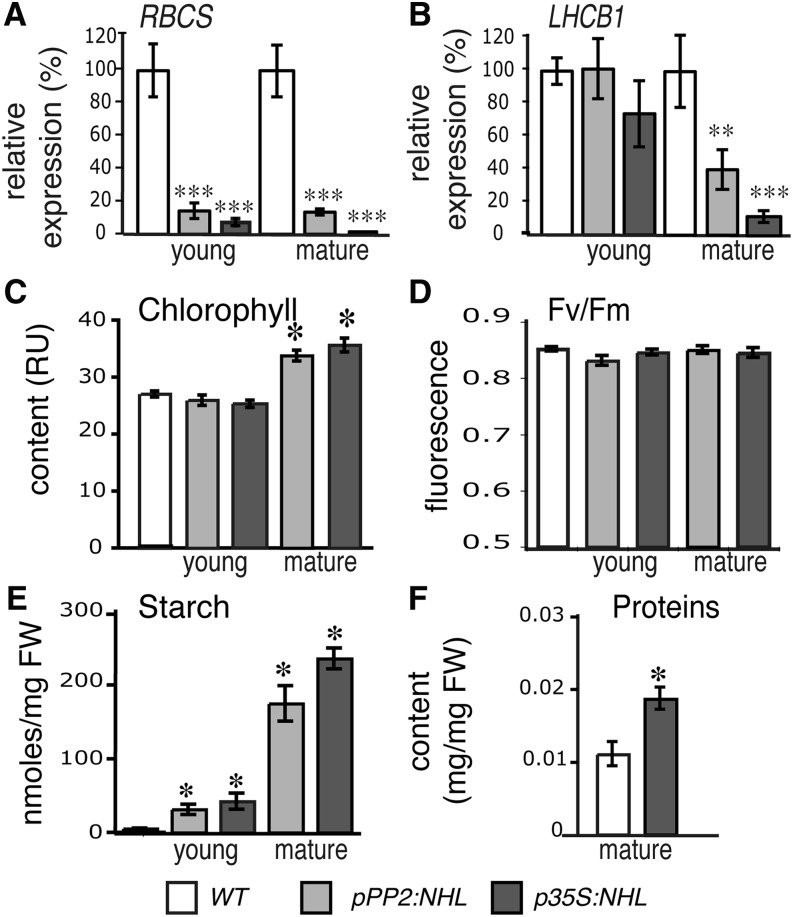
Figure 5.
Starch Accumulation and Photosynthetic Activity in NHL26-Overexpressing Lines.
(A) and (B) Changes in the transcript abundance of two photosynthesis genes in NHL26-overexpressing lines.
(A) Relative expression of RBCS in young and mature leaves.
(B) Relative expression of LHCB1 in young and mature leaves. Mature leaves presenting strong reddening were analyzed. The expression of these genes was assessed by qRT-PCR and normalized relative to that of APT. The data points and error bars represent the mean and se (n = 6).
(C) and (D) Photosynthetic parameters in p35S:NHL- and pPP2:NHL-expressing plants. The chlorophyll content, measured in Relative Units, RU (C) and chlorophyll fluorescence (Fv/Fm) of PSII (D) were measured in the rosette leaves of 8-week-old plants (stage 6.50) grown in the greenhouse. Chlorophyll content is expressed in relative SPAD units. The data points and error bars represent the mean and se of two measurements (n = 12).
(E) Starch content of the rosette leaves of pPP2:NHL- and p35S:NHL-expressing and wild-type plants. Plants were harvested at stage 6.0. The data points and error bars represent the mean and se (n = 12). FW, fresh weight.
(F) Protein content of the mature rosette leaves in wild-type and pPP2:NHL- and p35S:NHL-expressing plants. Plants were harvested at stage 6.0. The data points and error bars represent the mean and se (n = 6).
Asterisks indicate values significantly different in a t test (*P < 0.05; **P < 0.02; ***P < 0.01). WT, the wild type.

