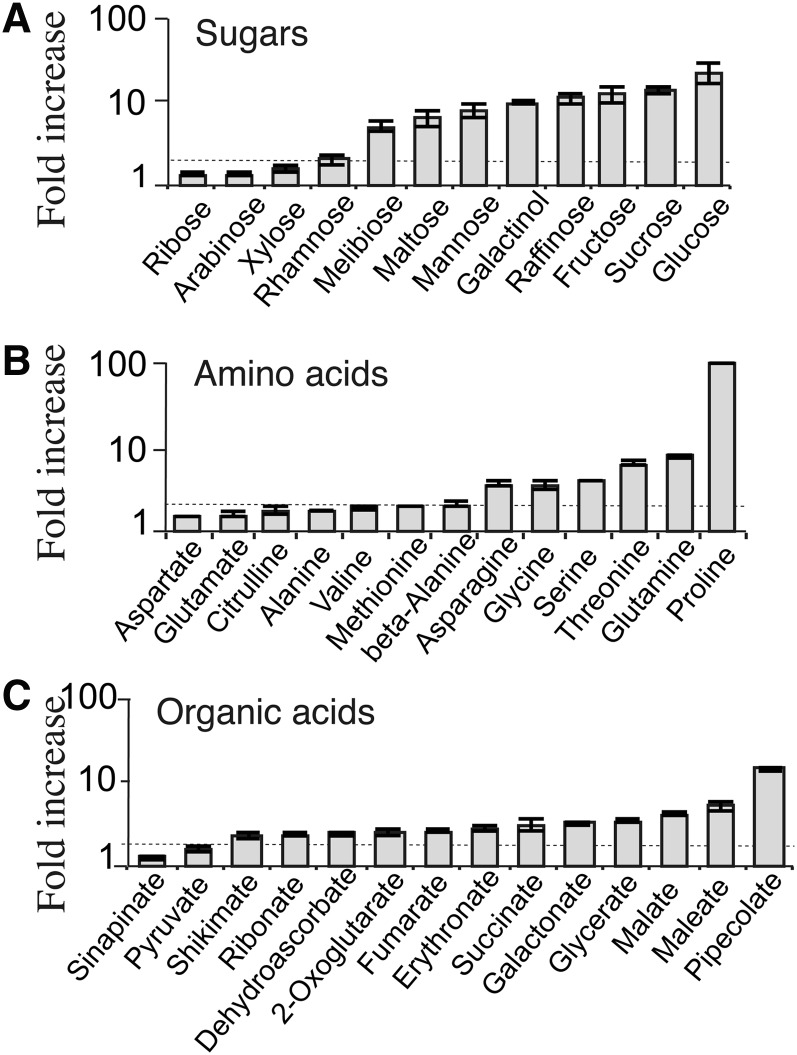
Figure 6.
Modification of the Metabolite Profile in NHL26-Overexpressing Lines.
Metabolites for which the abundance in the rosette leaves of p35S:NHL-overexpressing plants was significantly different from that in wild-type controls (P > 0.01). Sugars (A), amino acids (B), and organic acids (C). Data are presented as fold increases with respect to the wild type on a log scale, for each compound, of the mean value obtained for p35S:NHL-expressing plants (±se; n = 6). The dotted line indicates the threshold for a twofold increase.

