Figure 7.
The NMT1 Mutation Affects the Proper Localization and Dynamics of ArfA1F at the Golgi.
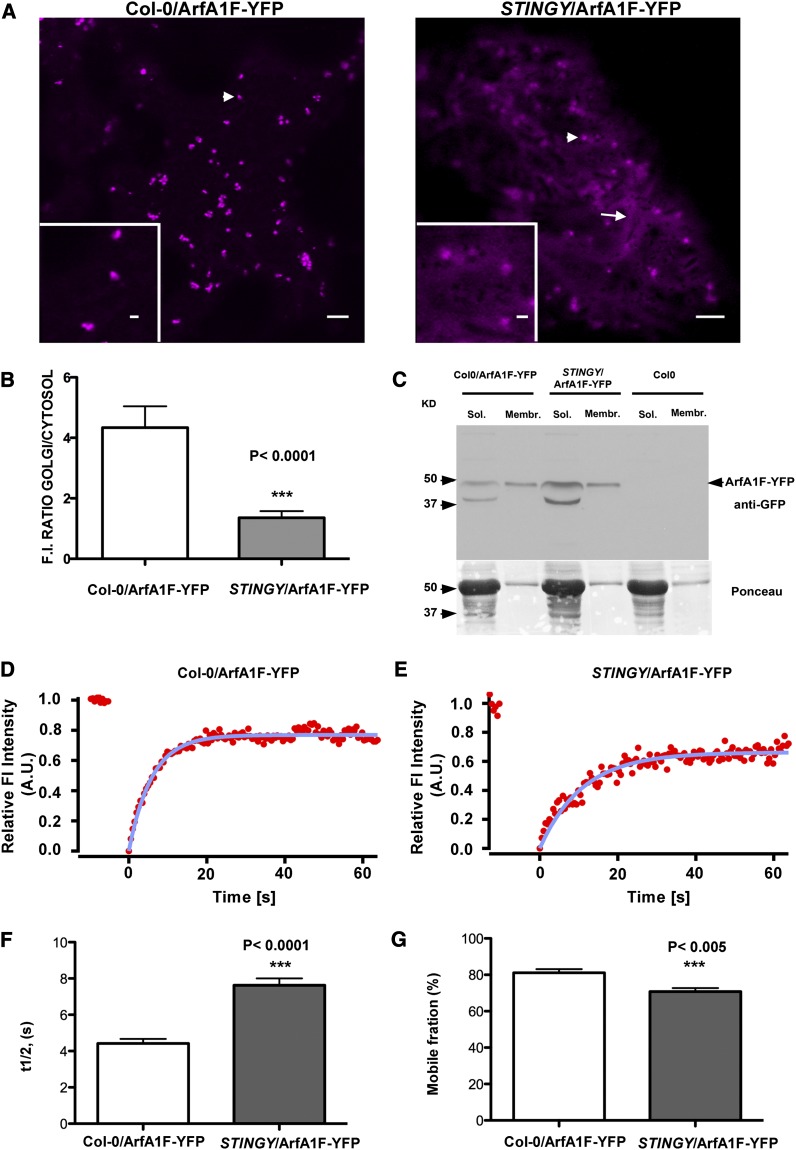
(A) Confocal live-cell images of a cotyledon epidermal cell of Col-0 and STINGY backgrounds stably expressing ArfA1F-YFP. Col0/ArfA1F-YFP shows ArfA1F localization mainly at punctate structures (left panel), which include Golgi stacks (see Supplemental Figure 10 online), while STINGY/ArfA1F-YFP also shows abundant ArfA1F localization in the cytosol. Bars = 5 μm; bar in the inset = 1 μm.
(B) The relative membrane/cytosol ArfA1F-YFP fluorescence distribution in both Col-0/ArfA1F-YFP and STINGY/ArfA1F-YFP is visualized as histograms, which report the ratio between the fluorescence intensity measured in regions of identical size for the punctate structures and the cytosol.
(C) Immunoblot analyses of ArfA1F-YFP (∼47 kD) using a GFP antibody on the soluble and membrane fractions of Col-0/ArfA1F, STINGY/ArfA1F, and Col-0. As supported by a comparison of the relative abundance of the bands in the soluble and membrane fractions in each sample, in STINGY, ArfA1F-YFP is more abundant in the soluble fraction than in the membrane fraction compared with the nonmutagenized Col-0-SEC-RFP control. Ponceau red staining represents the protein loading control.
(D) and (E) FRAP curves representing the time course of ArfA1F-YFP (starting at 0 s) for Col-0/ArfA1F-YFP and STINGY/ArfA1F-YFP.
(F) Representation of the half-time recovery (s) of ArfA1F-YFP in Col-0 and STINGY backgrounds. A.U., arbitrary units.
(G) Representation of the mobile fraction (%) for ArfA1F-YFP in Col-0 and STINGY backgrounds. The difference in fluorescence recovery half-times and the mobile fraction between the samples is significant, as indicated by the P value on the charts ([F] and [G]).

