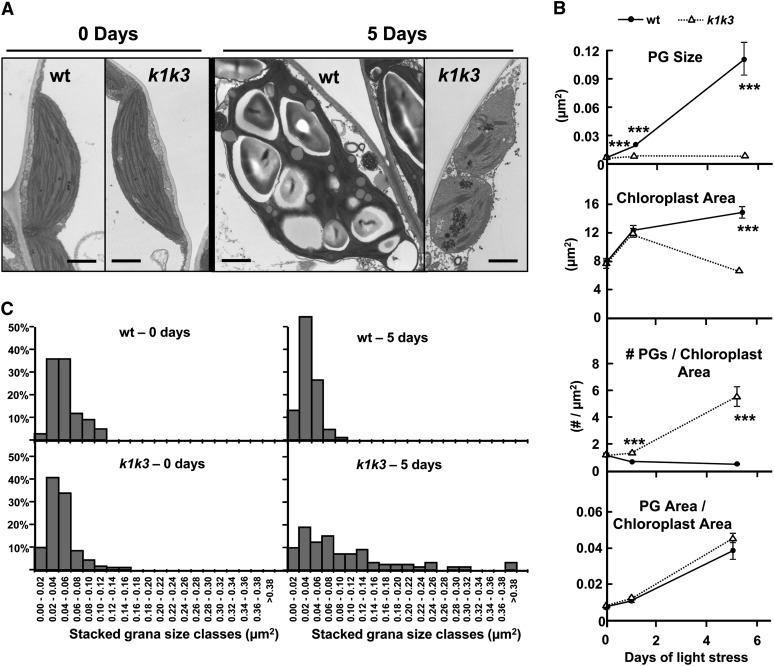
Figure 6.
Plastid Ultrastructure in the Wild Type and k1 k3 Responds Differently to 5× Light Stress.
(A) Representative TEM micrographs after 0 and 5 d illustrate the genotype-specific responses to 5× light stress in the chloroplast ultrastructure. Mature leaf tissue was harvested 2 h after the onset of the photoperiod after 0, 1, and 5 d of 5× light stress. All micrographs are to the same scale. wt, the wild type. Bar = 1 µm.
(B) Graphs of four parameters measured from TEM micrographs. Each data point represents the mean measurement from 24 micrographs of three different plants. Error bars represent the se. The asterisks indicate P < 0.001 (Student’s t test) between the two genotypes at a given time point.
(C) Histogram demonstrating the granal hyperstacking in k1 k3 after 0 and 5 d of 5× light stress. At least 80 granal stacks from three individuals were measured for each genotype at each time point.

