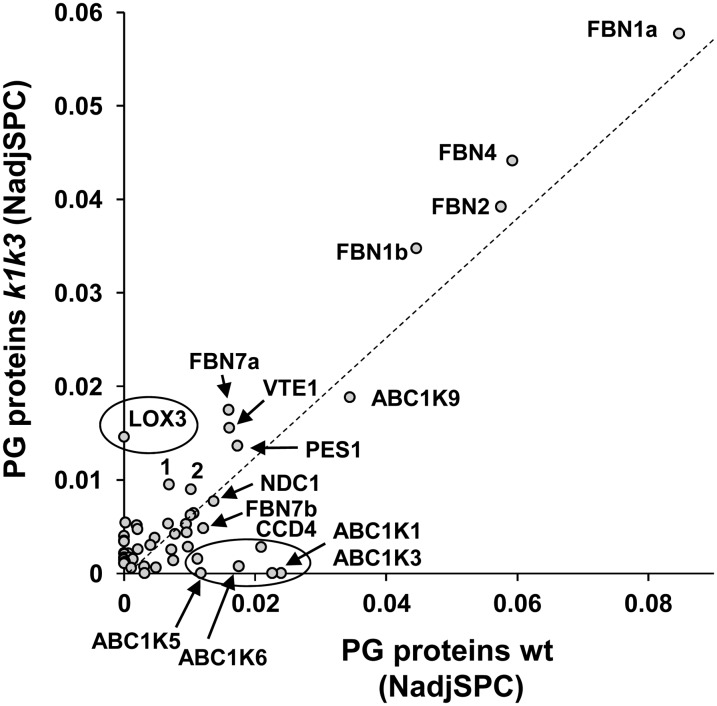
Figure 8.
Comparison of Protein Abundance in Isolated PGs from the Wild Type and k1 k3 after 5 d of Light Stress.
Abundance of proteins enriched in the wild type (wt) and/or k1 k3 PGs were plotted. The dashed line indicates the best fit. Those proteins deviating from this line (in particular those circled) are over- or underrepresented in k1 k3 PGs. 1, Unknown1 (AT4G13200); 2, SOUL protein (AT3G10130). Details and accession numbers can be found in Supplemental Data Set 3 online. The same plot with sd (n = 3) is shown in Supplemental Figure 9 online.

