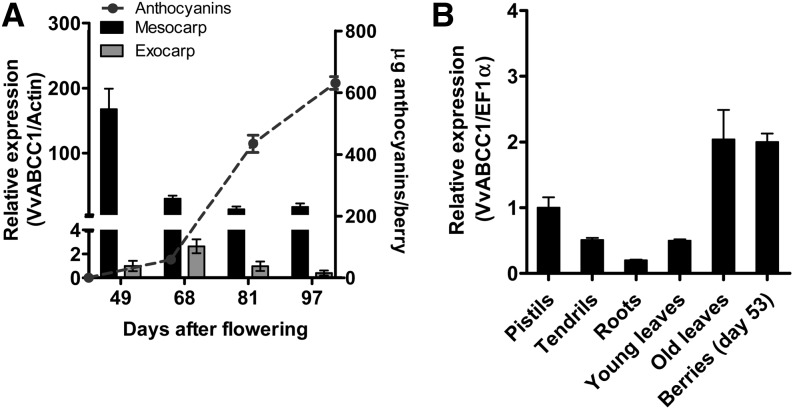
Figure 2.
Quantitative Real-Time PCR Expression Profile of ABCC1.
(A) Expression profile of ABCC1 in grape berry tissues during fruit maturation. Transcript levels of ABCC1 were normalized to the grapevine Actin gene. Results represent the mean ± se of three replicates. Total anthocyanin content in grape berries during fruit maturation represented by the mean ± se of six biological replicates is shown.
(B) Transcript levels of ABCC1 in various grapevine organs. Young leaves correspond to leaves with a fresh weight of 0.3 g, and old leaves are fully expanded and had a mean fresh weight of 2.8 g. Gene expression was normalized to the grapevine EF1α reference gene. Results represent the mean ± se of three replicates.

