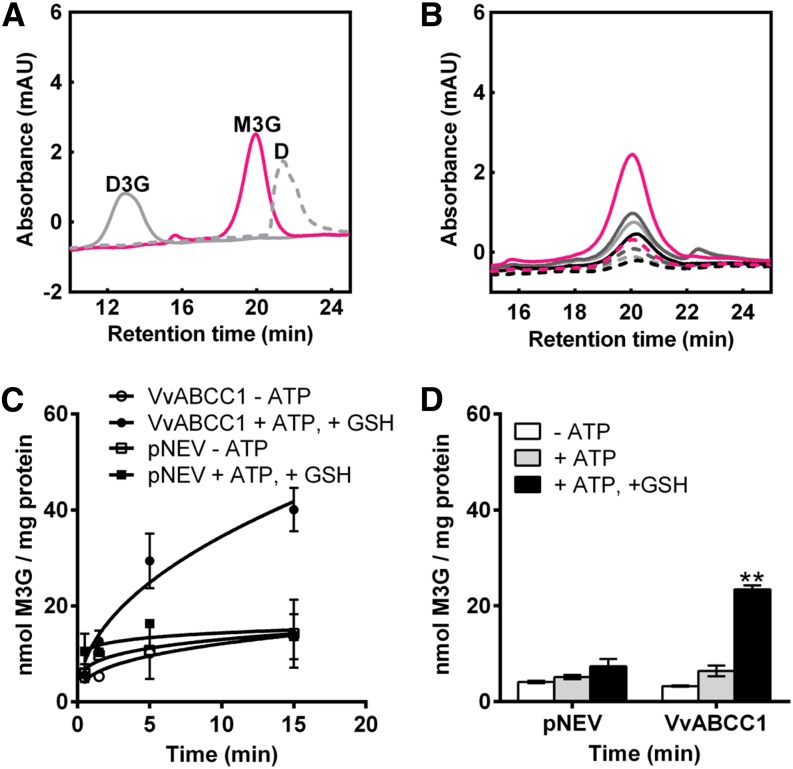
Figure 4.
ABCC1 Transports M3G in Yeast Microsomal Vesicles.
(A) HPLC profiles of M3G (pink line), D3G (gray solid line), and delphinidin (D; gray dotted line) standards; mAU, mili absorbance units.
(B) HPLC analysis of M3G taken up into microsomal vesicles isolated from yeast cells expressing Vv-ABCC1. Light-gray dotted line, −ATP, 5 s of incubation; light-gray solid line, −ATP, 15 min; dark-gray dotted line, +MgATP, 5 s; dark-gray solid line, +MgATP, 15 min; black dotted line, −ATP, +GSH, 5 s; black solid line, −ATP, +GSH, 15 min; pink dotted line, +ATP, +GSH, 5 s; pink solid line, +ATP, +GSH, 15 min.
(C) Time-dependent uptake of M3G into vesicles isolated from yeast cells transformed either with the empty vector (pNEV) or with Vv-ABCC1. Results are presented as mean values ± se of two independent uptake experiments.
(D) Net M3G uptake by ABCC1 and its vector control. Net transport was calculated by subtracting the 5-s values from the values measured after 15 min. Results are presented as mean values ± se of three independent uptake experiments; asterisks indicate statistical significance (Student’s t test; P < 0.01).

