Figure 5.
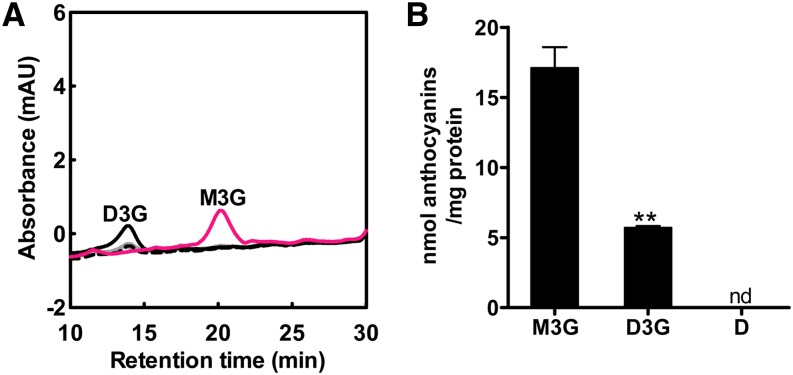
ABCC1 Transports Specifically Glucosylated Anthocyanins.
(A) HPLC profile of D3G taken up into microsomes isolated from Vv-ABCC1–transformed yeast cells. Light-gray dotted line, −ATP, 5 s; light-gray solid line: −ATP, 15 min; black dotted line, +ATP, +GSH 5 s; black solid line, +ATP, + GSH, 15 min; pink solid line, M3G uptake in the presence of both ATP and GSH, 15 min. No absorbance peak corresponding to delphinidin was observed. Transport experiments were performed at room temperature. The data represent the means ± se of two independent uptake experiments performed with microsomes from two independent preparations; mAU, mili absorbance units.
(B) Microsomes isolated from yeast cells transformed with Vv-ABCC1 transport preferentially M3G and to a lesser extent D3G, but not delphinidin (D). The data represent the means ± se of two independent uptake experiments performed with microsomes from two independent preparations. Asterisks indicate statistical significance (Student’s t test; P < 0.01); nd, not detectable.

