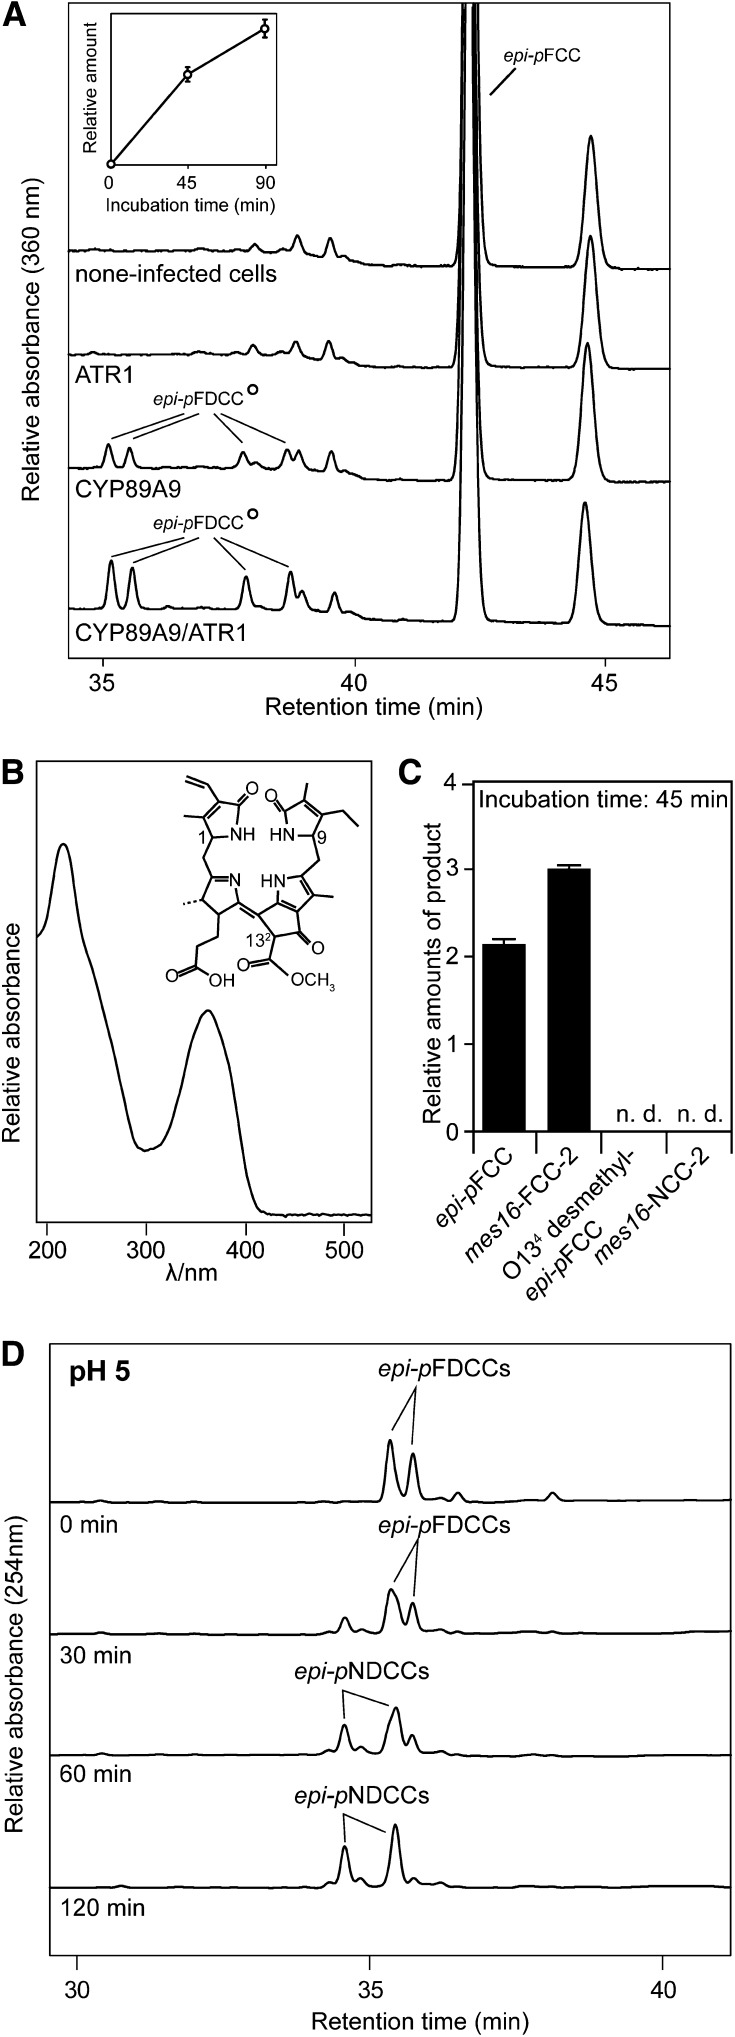
Figure 6.
Analysis of Recombinant CYP89A9.
(A) HPLC analysis of assays employing Sf9 microsomes expressing CYP89A9 and ATR1, and epi-pFCC as substrate. HPLC traces at A360 after 90 min of incubation at 28°C are shown. For clarity, only the relevant part of the HPLC traces is shown. The inset shows the relative amounts of formed epi-pFDCCs. Values are means of three replicates. Error bars indicate sd.
(B) UV absorption spectrum of epi-pFDCCs produced with recombinant CYP89A9 and chemical constitution of (epi-)pFDCCs. Relevant stereocenters are labeled.
(C) Substrate specificity of CYP89A9. Values are means of three replicates. Error bars indicate sd.
(D) FDCC-to-NDCC isomerization assays. The two most polar epi-pFDCCs produced with recombinant CYP89A9 were incubated at pH 5.0 for up to 120 min and analyzed by HPLC. A254 is shown.

