Figure 2.
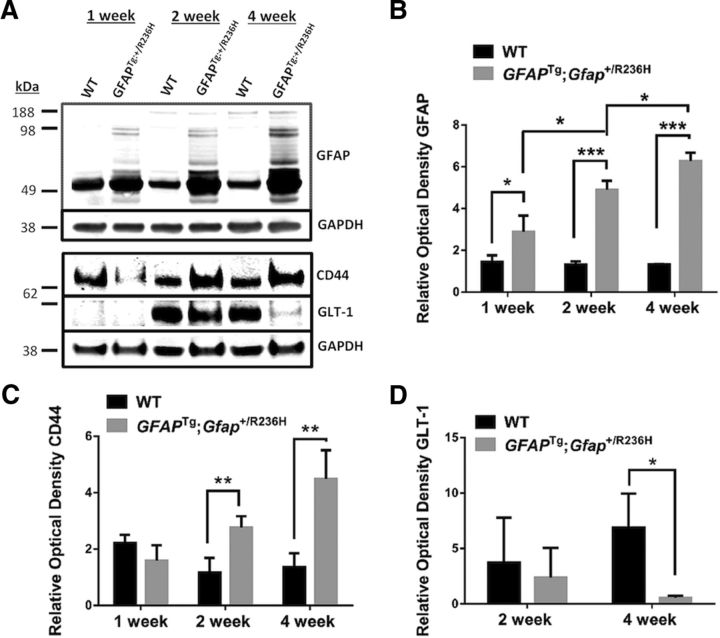
Increased protein levels of GFAP and CD44 and decreased GLT-1 in the hippocampus of GFAPTg;Gfap+/R236H (Tg/KI) mice compared with the hippocampus of WT mice. A, Western blot analysis of GFAP (10 μg of total protein load/lane), CD44 (55 μg/lane), and GLT-1 (55 μg/lane) in hippocampi of 1, 2, and 4 week WT and GFAPTg;Gfap+/R236H (Tg/KI) mice. GAPDH is assessed as a loading control. B–D, Quantitation of GFAP (B), CD44 (C), and GLT-1 (D) levels on Western blots based on optical densities normalized to the level of GAPDH. Note that for the GFAP, we scanned all immunoreactive bands, not only the main band at 50 kDa. Data are mean ± SEM of 3 (GFAP) or 4 (GLT-1 and CD44) independent experiments. Two-way ANOVA with Tukey test; *p < 0.05, **p < 0.005, ***p < 0.0005. Only significant differences are marked on the graphs.

